

Abstract
Strategies toward ambitious climate targets usually rely on the concept of 'decoupling'; that is, they aim at promoting economic growth while reducing the use of natural resources and GHG emissions. GDP growth coinciding with absolute reductions in emissions or resource use is denoted as 'absolute decoupling', as opposed to 'relative decoupling', where resource use or emissions increase less so than does GDP. Based on the bibliometric mapping in part I (Wiedenhofer et al, 2020 Environ. Res. Lett. 15 063002), we synthesize the evidence emerging from the selected 835 peer-reviewed articles. We evaluate empirical studies of decoupling related to final/useful energy, exergy, use of material resources, as well as CO2 and total GHG emissions. We find that relative decoupling is frequent for material use as well as GHG and CO2 emissions but not for useful exergy, a quality-based measure of energy use. Primary energy can be decoupled from GDP largely to the extent to which the conversion of primary energy to useful exergy is improved. Examples of absolute long-term decoupling are rare, but recently some industrialized countries have decoupled GDP from both production- and, weaklier, consumption-based CO2 emissions. We analyze policies or strategies in the decoupling literature by classifying them into three groups: (1) Green growth, if sufficient reductions of resource use or emissions were deemed possible without altering the growth trajectory. (2) Degrowth, if reductions of resource use or emissions were given priority over GDP growth. (3) Others, e.g. if the role of energy for GDP growth was analyzed without reference to climate change mitigation. We conclude that large rapid absolute reductions of resource use and GHG emissions cannot be achieved through observed decoupling rates, hence decoupling needs to be complemented by sufficiency-oriented strategies and strict enforcement of absolute reduction targets. More research is needed on interdependencies between wellbeing, resources and emissions.
Export citation and abstract BibTeX RIS

Original content from this work may be used under the terms of the Creative Commons Attribution 4.0 license. Any further distribution of this work must maintain attribution to the author(s) and the title of the work, journal citation and DOI.
1. Introduction
Many policy documents and scientific publications, including those of the IPCC, assume that economic growth will continue to be a cornerstone of thriving future societies. However, if economic growth is accompanied by increases of resource use and emissions (Steinberger et al 2013, Hickel and Kallis 2019), it may threaten chances of meeting future sustainability transformation goals. Achieving targets such as the SDGs (TWI2050, 2018) or the Paris climate accord to limit global heating to 1.5 °C–2.0 °C (IPCC 2018) requires reducing emissions of greenhouse gases (GHG) to zero around 2050, and most likely also absolute reductions of the use of natural resources such as energy or materials in many world regions. In many scenarios, net negative emissions, achieved either through reforestation and other land-based 'natural climate solutions' (Griscom et al 2017) or negative emission technologies (Fuss et al 2018, Minx et al 2018, Nemet et al 2018, Rogelj et al 2019), are required after 2050 to bring the climate back from an overshoot over the climate-change mitigation targets to the specified target level. The need for 'negative emissions' emerges in all scenarios that fail to achieve sufficient cuts in emissions in the first half of the century (IPCC 2018).
If achieving ambitious climate and sustainability targets should be reconciled with continued GDP growth, an absolute decoupling (or 'de-linking'; (Vehmas et al 2003)) of GDP from the use of biophysical resources and/or emissions is a logical necessity (UNEP 2011a, Hickel and Kallis 2019, Jackson and Victor 2019, Parrique et al 2019, UNEP-IRP 2019). In this set of two articles, we present a systematic review of the empirical literature on past (de)coupling of resource use and emissions and GDP. Part I has provided a bibliometric mapping of this literature and focuses on how decoupling is empirically analyzed in various strands of research (Wiedenhofer et al 2020). Here in part II, we synthesize the evidence in this literature with respect to observed historical (de)coupling and discuss its implications for science and policy.
We analyze the scientific literature on the relationships between economic output (most commonly measured as inflation-corrected GDP) and resource use or emissions and the observed rates of relative and absolute decoupling. We aim at elucidating the potential contribution of past and ongoing gains in economy-wide efficiency and productivity towards absolute decoupling and zero carbon futures. The socio-ecological systems perspective of socio-economic metabolism (Fischer-Kowalski 1998, Pauliuk and Müller 2014, Pauliuk and Hertwich 2015, Haberl et al 2019) stresses that socio-economic systems continuously require materials and energy for all economic activity and the reproduction of humans, livestock, and all manufactured capital, which necessarily leads to emissions and waste. From this perspective, materials, energy, waste and emissions are inextricably interlinked and therefore need to be treated jointly, an idea sometimes denoted as 'resource nexus' (Bleischwitz et al 2018b). The broad scope of this systematic review was motivated by the aim to capture such systemic linkages, as they are increasingly acknowledged as important for both science and policy (Haberl et al 2019). The scale and patterns of socio-economic metabolism are also directly entangled with past and future development pathways, as well as with socioeconomic structures and policies. To capture such linkages, and to address the question to what extent the resource/GDP relations might be amenable to active intervention, the review also aims to map the key strategies discussed by the literature to achieve decoupling (section 4).
It is important to distinguish resource decoupling (e.g. decoupling of GDP from energy or material use) from impact decoupling (e.g. the decoupling of GDP from GHG emissions) (UNEP 2011a, Jackson and Victor 2019). While reduction of resource use will—ceteris paribus—always reduce impacts because fewer resources need to be extracted, processed or disposed of, some (probably not all) impacts can also be reduced and redirected through technological measures (e.g. flue gas treatment or substitution of low-carbon fuels for high-C fuels such as coal or oil products), even if resource use is not reduced. For GHG emissions, such options are intensively researched and may gain importance in the future (based on carbon capture and sequestration or CCS technologies; (Fuss et al 2014)). However, they are currently not deployed and hence are not included in this review, which only covers studies of observed past decoupling, and excludes all model-based studies on future scenarios. This focus is supported by IPCC reports demonstrating that energy efficiency and demand-side measures have less risks and are more benevolent to societies than technological fixes (IPCC, 2014, Creutzig et al 2016, 2018).
A key issue for decoupling and decarbonization, which plays a big role in this review, is global trade and its role in connecting producers and consumers. There are three complimentary perspectives (Steininger et al 2015). (1) The production-based (territory-based) perspective accounts for resources used in or emissions emerging from a territory. It underlies emission accounts of the UNFCCC. (2) The consumption-based perspective accounts for resources used or emissions emerging—no matter where in the world—along supply chains and required to meet the final demand of a national economy. Such a perspective is required to account for displacements and problem shifting through international trade, e.g. 'improvements' of energy intensity (energy/GDP) resulting from increasing imports of embodied energy in imported goods that help reducing the need to produce these goods domestically (Moreau and Vuille 2018, Moreau et al 2019). (3) The income-based perspective accounts for resources used in or emissions emerging in the generation of income for a given country (Rodrigues et al 2006, Marques et al 2012). However, the difference between consumption-,production- and income based accounts cannot simply be interpreted as 'leakage' or 'outsourcing' (Jakob and Marschinski 2013), as the attribution of responsibility along supply chains is complex (Rodrigues et al 2006, Rodrigues and Domingos 2008, Schaffartzik et al 2015, Steininger et al 2016). Recognition of this challenge has resulted in proposals of various methods to derive displacement indicators (Kander et al 2015, Jiborn et al 2018). Data allowing the allocation of resource use or emissions directly or indirectly occurring along international supply chains to final consumers are recently becoming available through the development of multi-regional input-output models (Peters 2008, Rodrigues et al 2010, Wiedmann et al 2015, Domingos et al 2016, Steininger et al 2015, 2016, Liang et al 2017). The production-, consumption- and income-based perspectives on resource use and emissions can result in widely diverging, if not opposing, results when analyzing the relations between resources/emissions and GDP hence both production- and consumption-based will be considered for a better assessment (see section 5; figure 2). We do not include the income-based perspective because studies with empirical results at the national or global level are rare (Rodrigues et al 2010, Marques et al 2012, 2013, Steininger et al 2016, Liang et al 2017)
In this evidence synthesis, we consider production- and consumption-based perspectives but restrict ourselves to national- and international studies, acknowledging that substantial amounts of work have been published on sub-national and city-level decoupling, as well as sectoral- or raw material/energy carrier specific perspectives. Including these literatures would not have been consistent with the comprehensive focus of this review. Moreover, studies with a narrow geographical or thematic scope cannot provide the top-down perspective necessary to identify problem-shifting and rebound effects in the global system in which we are particularly interested. Specifically, we address the following research questions:
- What is the empirical evidence for relative or absolute decoupling of economic output from resource use and emissions at the national-to-global level?
- Which strategies and policy recommendations are discussed by the literature empirically investigating efficiency and decoupling trends? Do they point towards a 'degrowth' or 'green growth' perspective?
- What can be learned from past decoupling trends for achieving future absolute reductions in resource use and GHG emissions?
2. Methods
In this article, we conduct an evidence synthesis for a body of the 835 peer-reviewed journal articles and book chapters identified in part I (Wiedenhofer et al 2020). There, we describe a search query to SCOPUS as well as ISI Web of Knowledge and an expert solicitation, yielding 11 609 references covering the time span between the first captured study from January 1972 until June 7, 2019. 8455 articles remained after duplicate removal, which we screened first at the level of titles and abstracts and second at the full-text level, eliminating all non-relevant articles and yielding the final 835 papers for in-depth review. Part I describes these procedures in detail, including criteria for exclusion as well as those applied at the coding stage. It also presents a bibliometric mapping of this body of literature and comparatively discusses the development of the identified research streams and their approaches to investigating decoupling phenomena.
For part II (this paper), we proceeded as follows. Because the body of literature on primary energy, territorial CO2 and on the causality relations between energy use and GDP is very large and recent reviews exist, we relied on these reviews and handpicked references to summarize their implications for the overall topic of this article (section 3.1). We then present an in-depth analysis of the following streams of literature: (1) Studies on useful energy and exergy, and a part of the literature on final energy (section 3.2). (2) Studies on aggregate material and energy flows following a social metabolism approach (section 3.3). (3) Studies on total GHG emissions as well as studies on carbon emissions from fossil fuel combustion and industrial processes, excluding studies only dealing with territorial CO2 emissions (section 3.4).
In section 4, we focus on discussing the strategies adopted (explicitly or implicitly) in the empirical decoupling literature. Due to the scope of this systematic review, conceptually and theoretically oriented papers explicitly focusing on policy choices were mostly excluded by the search query. Therefore, our analysis is restricted to policy recommendations and strategies found in papers that have a focus on biophysical evidence rather than politics. For the qualitative mapping and synthesis of strategies and policy recommendations, we drew a random subsample of 15% from the 835 articles, yielding 125 articles for further qualitative content synthesis. We used widely accepted definitions of green growth and degrowth to interpretatively map the 125 papers according to these definitions:
- For green growth, we refer to three major international institutions (OECD, UNEP and the World Bank) that promote green growth (OECD 2011, UNEP 2011b, World Bank 2012). Their definitions range from relative decoupling (World Bank 2012) to absolute decoupling (OECD 2011, UNEP 2011b, p 2011, World Bank 2012). Articles were classified as 'green growth' if their framing aimed at absolute or relative decoupling without impeding economic growth.
- Articles were classified as 'degrowth' if their framing explicitly challenged the primacy of economic growth over the (absolute) reduction of resource use and emissions, or articles that were agnostic towards economic growth (van den Bergh and Kallis 2012). We included articles in this category, based on their empirical findings, if they at least challenged economic growth as a 'taken for granted' variable. That is, we included articles that either proposed an 'equitable downscaling of economic production and consumption' (degrowth; quote on p 910) or adopted an 'indifferent' (p 912) position towards the effects of certain policy measures on economic growth (a-growth) (van den Bergh and Kallis 2012).
- Papers not meeting the above criteria were classified as 'others'. This category mostly includes papers which were primarily concerned with the causality between GDP and energy use or GHG emissions without expressing any aim of reducing emissions or resource use.
We openly coded the subsample (based on abstract, introduction, conclusion, and, if applicable, policy recommendations) according to the strategies and policies they recommended. In a next step, we merged these open codes to derive manageable and meaningful findings. For example, we merged the recommendations 'internalization of external environmental goods', 'regulate prices' and 'environmental taxes' into the category 'pricing'.
3. Synthesis of key insights and quantitative evidence on decoupling
In this section, we comparatively review the literature on the relation between economic growth and various resource-use and emission indicators, covering both production- and consumption-based studies. We critically examine the state and trajectory of these research streams and summarize their key insights and quantitative results on relative and absolute decoupling.
We start by summarizing the evidence on the coupling between GDP and primary energy respectively territorial CO2 emissions, which are closely related because burning fossil fuels (which account for a large fraction of primary energy in most countries) is the dominant source of CO2 emissions (section 3.1). In contrast to sections 3.2–3.4, this section does not undertake an analysis of all articles within this category; we instead rely on recent major reviews and selected studies. We then summarize the findings on the extent of decoupling between GDP and final energy as well as exergy (section 3.2), i.e. indicators that are much more closely linked to the actual functions, utility and services of energy for socio-economic activities (Lovins 1979, Haas et al 2008, Kalt et al 2019). Section 3.3 presents the evidence on the (de)coupling between GDP and comprehensive measures of social metabolism derived with the harmonized and internationally applied economy-wide material and energy flow analysis (MEFA) framework (Haberl et al 2004, Fischer-Kowalski et al 2011, Krausmann et al 2017a). This comprehensive perspective covers combustible energy carriers such as fossil fuels, as well as non-metallic minerals, ores and metals and biomass, which are all required for socio-economic activities and are highly interlinked (Schandl et al 2018, Krausmann et al 2017a, Bleischwitz et al 2018b). Section 3.4 summarizes the evidence on the coupling between GDP and emissions based on full GHG accounts (including agriculture, forestry, and other land use (AFOLU) and non-carbon greenhouse gases, consumption-based CO2 emissions as well as territorial and consumption-based full GHG accounts).
3.1. Primary energy and territorial CO2 emissions
Although neo-classical economic growth models (see Aghion and Howitt 2009) do not include energy as a production factor, the relationship of energy use and economic growth has gained significant attention in recent research. Recognizing that standard regression methods are insufficient with regard to avoiding spurious correlation,10 cointegration and Granger causality tests have been the predominant approaches for time-series statistical analysis from the 1970s onwards (Stern 2011). Cointegration testing identifies long-term equilibria between two or more non-stationary variables (Enders 2014). Granger causality tests analyze the direction of causality, i.e. whether one time series is useful in forecasting another (Granger 1969).
Using these well-established methods, this large body of literature finds that long-run primary energy-GDP cointegration exists across a wide range of temporal and geographic scales. However, the direction of the energy-GDP Granger causality is inconclusive, as directionalities differed according to the considered regions, timeframes and methods used (Ozturk 2010, Stern 2011, Kalimeris et al 2014, Omri 2014, Tiba and Omri 2017). Besides the lack of directionality, energy-GDP Granger causality testing itself is somewhat controversial. For example, Bruns et al (2013) suggest there is a prevalence of model misspecification and publication bias.11 Other scholars criticize the 'speculative and exploratory' nature of the Granger causality debate (Beaudreau 2010) and that the same methodological approaches continue to be applied although they have proven to be inadequate for resolving the question of directionality (Karanfil 2009, Ozturk 2010, Kalimeris et al 2014, Tiba and Omri 2017).
Stern (Stern 1997, 2011) argues that regardless of whether econometric approaches find empirical evidence for causality in one or another direction, energy is always an essential factor of production. This viewpoint is corroborated by several studies reviewed in section 3.2 and has long been voiced by 'biophysical economists' (Hall et al 1986, Cleveland 1987, Kümmel 2011). Based on a synthesis of energy-based and mainstream models of economic growth, (Stern 2011) finds that energy scarcity imposes a strong constraint on economic growth. He also identifies factors that could affect the linkages between energy use and economic output, and are therefore key to gauging the extent of a possible decoupling of GDP from energy use: substitution between energy and other inputs such as capital and labor, technological change, and shifts in the composition of energy inputs and in the economic structure.
Around 80% of global GHG emissions originate from combustion of fossil fuels. Given the historical coupling between primary energy and GDP, we might expect a similar coupling relationship between territorial CO2 emissions and GDP at the global level (Bassetti et al 2013, Stern 2017). The empirical evidence supports that assertion: global GDP (constant $US2010) grew at 3.5%/year from 1960–2014, while CO2 emissions grew at 2.5%/year on average (World Bank 2019a); i.e. globally there is relative but no absolute decoupling. Between 2000 and 2014, the relationship was even tighter, as both CO2 emissions and GDP (constant $US2010) grew at 2.8%/year on average.
At the international level, studies examining the relationships between territorial CO2 emissions and GDP typically also find weak or relative decoupling (Vollebergh et al 2009, Longhofer and Jorgenson 2017, Stern et al 2017, Sarkodie and Strezov 2019). A few studies find absolute decoupling (Azam and Khan 2016, Roinioti and Koroneos 2017, Chen et al 2018, Madaleno and Moutinho 2018), but these are usually relatively small, short-term reductions of CO2 emissions (Li et al 2007). A few country-level GDP-CO2 studies find empirical support for an Environmental Kuznets Curve (EKC) type relationship, whereby CO2/capita rises and then falls with rising GDP/capita, i.e. income (Stern 2017). National-level studies (Peters and Hertwich 2008, Kander et al 2015, Azam and Khan 2016, Hardt et al 2018, Moreau and Vuille 2018, Moreau et al 2019, Wood et al 2019a) emphasize the role of 'offshoring' emissions (e.g. related to imported goods) and changes in economic structure (e.g. shrinking carbon-intensive industry, larger contributions from service sectors) in distorting the GDP-CO2 relationship in one or the other direction. Variability in primary energy composition and different stages in renewable energy deployment are also seen as key reasons for differing results regarding the existence of an EKC for CO2 (Chien and Hu 2007, Fang 2011, Menegaki 2011, Tiwari 2011, Salim and Rafiq 2012, Tugcu et al 2012, Yao et al 2019).
3.2. Final and useful energy, as well as exergy
Socioeconomic energy flow analyses trace the flow from primary energy extracted from the environment (e.g. crude oil or solar radiation) to final energy put to use in production or consumption (e.g. gasoline or electricity) to useful energy actually performing a specific function (e.g. mechanical work or heat). While data on primary and final energy are readily available from statistical sources in reasonably standardized manner (IFIAS 1974, IPCC 2014), data on useful energy (i.e. the energy actually performing useful work) must be inferred and are only exceptionally reported. Exergy evaluates the thermodynamic quality of these energy flows by quantifying the maximum amount of work (mechanical energy) that a given amount of energy can provide. For example, as electricity can be completely converted into work (i.e. it is equivalent to mechanical work), 1 kWh of electricity has an exergy of 1 kWh. By contrast, the exergy of 1 kWh of heat at 80ºC in an environment at 20ºC is only 0.17 kWh. Data on exergy are not reported by statistical bodies, therefore the community interested in the relation between exergy and economic activity needs to calculate exergy equivalents of primary, final or useful energy flows (Ayres et al 2003).
Research on the relationship between final energy and economic growth is often motivated by questions on energy efficiency. Energy efficiency is usually defined as GDP per unit energy used (see Hu and Kao 2007, Marcotullio and Schultz 2007, Jakob et al 2012, Borozan 2018, Cunha et al 2018, Moreau et al 2019) or its inverse, energy intensity (see Ang and Liu 2006, Duro et al 2010, Liddle 2012, Mulder and de Groot 2012). Some studies find strong linkages between final energy use and GDP (e.g. Kim 1984, Stjepanović 2018), while others find evidence for some degree of decoupling, mostly at the national scale (e.g. Jakob et al 2012, Liddle 2012, Mulder and de Groot 2012, Naqvi and Zwickl 2017). Several studies argue that the observed decoupling can be attributed to structural changes in the economy and outsourcing of energy-intensive activities (e.g. Moreau et al 2019). A recent scenario suggests that low primary energy demand is compatible with staying well below 2 °C and providing services that enable wellbeing for all (Grubler et al 2018) .
Regarding the wealth of studies investigating the energy-GDP relationship applying cointegration and causality tests based on primary energy consumption (see section 3.1), it is somewhat surprising that there are hardly any studies applying such methods to final energy or exergy and GDP. Among the few exceptions are Antonakakis et al (2017) and Belke et al (2011). Both find evidence for bi-directional causality, i.e. for final energy consumption being a driver for GDP as well as vice versa.
The number of studies analyzing exergy flows is comparatively small (see table 1b). Most studies investigating exergy flows find relative decoupling of GDP from primary and final exergy (e.g. Ayres et al 2003, Warr et al 2010, Serrenho et al 2014, Guevara et al 2016, Jadhao et al 2017). In contrast, no significant improvements in intensities or long-term decoupling were found for useful exergy. Some studies even found increasing useful exergy intensities, in particular during periods in which the contribution of industry to GDP respectively industry's share in final energy use rise (e.g. Warr et al 2008, 2010, Guevara et al 2016); others did not detect a clear trend (e.g. Serrenho et al 2014, 2016). Exergy studies found considerable gains in the conversion efficiency from primary to useful exergy (exergy efficiency), but also a slowdown of efficiency gains since the 1970s (Ayres et al 2003, Warr et al 2010).
Table 1. Analysis of the studies on final energy, useful energy and exergy. All studies with one exception reported in the last column refer to production-based (territorial) accounting principles; very few report on the difference between the growth rate of GDP and resource use, so these columns were omitted. Where available, quantitative information on decoupling was integrated in the text in the last column. Acronyms: APEC... Asia-Pacific economic cooperation; DEA...Data envelopment analysis; EU...European Union; IEA...International Energy Agency; EU-KLEMS...Capital (K), labour (L), energy (E), materials (M) and service (S) inputs database of the EU; GHG...Greenhouse gas; ICT...Information and communication technology; LINEX...Linear-exponential production function; NUTS... Nomenclature des unités territoriales statistiques; OLS...Ordinary least square analysis; STAN...STructural analysis database of the OECD; TPES...Total primary energy supply; TFEC...Total final energy consumption; UK...United Kingdom; USA...United States of America.
| Reference | Country/region | Period | Indicator(s) | Method(s) | Conclusions regarding decoupling |
|---|---|---|---|---|---|
| (a) Final energy | |||||
| Kim 1984 | Asia-Pacific | 1960–1980 | Commercial energy | Pooled cross-country analysis | Finds strong association between GDP and energy consumption from 1960–1980; energy/GDP elasticities are: China 1.07, Japan 1.01, Korea 0.96 |
| Ang and Liu 2006 | 100 countries | 1997 | Final energy & CO2 intensity | Cross-sectional analysis | Final energy/GDP is smaller in countries with higher per-capita income. The relation between aggregate CO2 intensity and GDP approximates the EKC model, i.e. is highest at intermediate per-capita incomes. |
| Hu and Kao 2007 | 17 APEC countries | 1991–2000 | Final energy from IEA | Data Envelopment Analysis (DEA) | DEA compares efficiencies among countries and thereby suggest energy-saving potentials; results resemble an EKC between per capita energy-saving potential and GDP. |
| Marcotullio and Schulz 2008 | 12 countries | 1960–2000 | TPES & TFEC | Cross-country comparison, trend analysis, OLS regressions | Energy supply and consumption patterns are more efficient in Asia-Pacific countries than in the USA. |
| Duro et al 2010 | OECD | 1980–2006 | Final energy intensity | Regression and decomposition analysis, econometric panel analysis | Finds that differences in GDP/cap are significant in explaining inequality in energy use per capita; reduction of energy intensity differences helped reducing the inequality in energy per capita. |
| Belke et al 2011 | 25 OECD countries | 1981–2007 | Final energy | Econometric causality tests | Finds bi-directional causality between energy consumption and GDP growth in the long run, i.e. increases in energy use lead to increased GDP growth and vice versa; supports the feedback hypothesis. |
| Liddle 2012 | 28 OECD countries | 1960–2006 | Final energy intensity | Cross-sectional analysis and descriptive trend analysis | OECD final energy intensity typically declines; finds trends towards convergence in final energy intensities among countries. Convergence is contingent on country-specific factors since differences in individual energy-GDP ratios persist. |
| Mulder and de Groot 2012 | 18 OECD countries | 1970–2005 | Final energy intensity | Decomposition analysis and descriptive trend analysis | The average annual growth rate of final energy intensity was −2.6%/year (EU-KLEMS data) and −1.5%/year (IEA and STAN data) between 1995–2005. |
| Vlahinic-Dizdarevic and Segota 2012 | 26 EU countries | 2000–2010 | Final energy (Eurostat) | Window analysis/DEA | Substitution among production factors and changes in the composition of energy use is possible in the medium run. Inefficient countries could improve by reducing some of the inputs. |
| Uwasu et al 2014 | 100 countries | 1970–2010 | Final energy | Econometric panel data analysis | The paper finds that income growth induces increasing final energy consumption and that geophysical factors (e.g. climate) influence the relation. In countries in cold climates with high energy consumption further increase in income do not result in growing energy use. |
| Antonakakis et al 2017 | 106 countries | 1971–2011 | Final energy use, GHG | Panel vector autoregression; impulse response function analyses | Causality between total economic growth and energy consumption is bidirectional; no evidence for renewable energy consumption promoting growth. |
| Naqvi and Zwickl 2017 | 18 EU countries | 1995–2008 | Final energy use, air pollutants | Decoupling indices as defined by OECD; WIOD database | This paper uses a consumption-based approach. It found that in almost all sectors the median EU country had at least some (relative) decoupling. |
| Borozan 2018 | EU regions (NUTS2) | 2005–2013 | Final energy use (Eurostat) | Data envelopment analysis; Tobit regression analysis | Regional differences in technical and energy efficiency are considerable; most of EU regions experienced declines of total factor energy efficiency in recession years. |
| Cunha et al 2018 | Portugal, UK, Brazil, China | 1990–2012 | Final energy | Index decomposition analysis | Overall energy efficiency (GDP/final energy) trends display different patterns between countries and sectors within countries; major drivers for energy efficiency improvements are the intensity and the affluence effect. |
| Stjepanović 2018 | 30 european countries | 1994–2016 | Final energy (Eurostat) | Panel data analysis | Strong correlation between final energy consumption and GDP growth in all monitored countries; but no short-term link between these variable in developed countries. |
| Moreau et al 2019 | EU-28 | 1990–2014 | Final energy use | Index decomposition analysis | Energy consumption reduction can largely be attributed to structural changes; an equally significant part is due to energy efficiency improvements; observed decoupling is largely due to outsourcing of energy intensive activities. |
| (b) Exergy | |||||
| Ayres et al 2003 | USA | 1900–1998 | Primary and useful exergy | Descriptive trend analysis | Finds relative decoupling of primary exergy from GDP; primary work per unit GDP peaks 1970 and then declines. Resource input is seen as a driver of GDP. Finds a positive feedback between useful work and GDP growth ('growth engine'). |
| Warr et al 2008 | UK | 1900–2000 | Useful exergy | Growth model using LINEX and Cobb-Douglas production functions; econometric time-series analysis. | The LINEX function with useful exergy, capital and labor as inputs is able to describe the GDP trajectory well. The marginal productivity of useful exergy has decreased in the UK since 1900; the ratio of useful exergy to GDP decreased since 1960. (This study assumes a 100% final-to-useful conversion efficiency of electricity). |
| Warr and Ayres 2010 | USA | 1946–2000 | Useful exergy | Econometric causality tests | Variations in useful work have no short-run effect on GDP but exert a long-run influence causing GDP to adjust to a new equilibrium level. Final exergy (energy) consumption and GDP can be (relatively) decoupled to an extent determined by the ability to increase exergy efficiency. |
| Warr et al 2010 | 4 countries | 1900–2000 | Primary and useful exergy | Descriptive trend analysis | Finds marked increases in exergy and useful work during industrialization as well as a common and continuous decrease in primary exergy intensity of GDP (relative decoupling). The trend of increasing useful work intensity of GDP reversed in the 1970 s (thereafter: relative decoupling). |
| Warr 2011 | Japan | 1900–2005 | Primary and useful exergy | Descriptive trend analysis, Granger causality tests; LINEX production function | Increases in useful exergy raise GDP, hence increases in the conversion of primary energy to useful exergy drive GDP growth ('economic growth engine'). Efficiency gains are required for GDP growth if resources are scarce. |
| Warr and Ayres 2012 | Japan and USA | 1950–2000 | Useful exergy | Growth model using LINEX non-adjusted and adjusted ICT functions. Econometric time-series analysis. | The ICT-adjusted LINEX function using useful exergy, capital and labor as inputs is able to describe the GDP trajectory well. The marginal productivity of useful exergy has increased in the US only between mid-70 s and late 80 s, while it has increased in Japan between 1950 and 1990. After 1990, both countries show a stable marginal productivity of useful exergy. |
| Serrenho et al 2014 | EU-15 | 1960–2009 | Useful exergy; final and useful exergy intensity | Econometric time series analysis | Final exergy intensity decreases faster in countries with higher intensities. Temporal trends are mainly explicable by efficiency improvements because useful exergy intensity shows no clear trend. Industrial high temperature heat and residential uses explain most of the variation in useful exergy intensities. |
| Serrenho et al 2016 | Portugal | 1856–2010 | Useful exergy, useful exergy intensity | Descriptive trend analysis | Finds no temporal trend of useful exergy intensity in Portugal, suggesting that further reductions in primary energy (or exergy) intensity may only be achieved by increasing exergy efficiency. However, recently efficiency stagnates and no decoupling was observed. |
| Guevara et al 2016 | Mexico | 1971–2009 | Final and useful exergy, useful exergy intensity | Descriptive trend analysis | Finds relative decoupling for final exergy, but an increasing useful exergy intensity of GDP (i.e. increasing coupling for useful exergy). |
| Jadhao et al 2017 | India | 1970–2010 | Final exergy intensity | Descriptive trend analysis | Final exergy intensity (final exergy per unit GDP) decreased throughout the period. |
| Arango-Miranda et al 2018 | 10 countries | 1971–2014 | CO2, TPES and primary exergy | Panel data analysis | The study finds a high correlation between CO2 emissions, energy use, primary exergy input and GDP. Neither an EKC type relation nor a causal relation between GDP and energy in the OECD was found. |
| Santos et al 2018 | Portugal | 1960–2009 | Primary energy, useful exergy | Econometric methods: cointegration analysis, Granger causality test | Finds relative decoupling of primary energy and GDP until the 1980 s, followed by stronger growth of primary exergy than GDP. Overall, no decoupling between GDP economic output and useful exergy. Finds cointegration of economic output and energy (primary energy or useful exergy), and that energy Granger-causes GDP growth. |
| Sakai et al 2019 | UK | 1971–2013 | Final energy, useful exergy | Macroeconomic resource consumption model considering thermodynamic efficiency | Gains in thermodynamic efficiency are a key 'engine of economic growth' that contributes 25% to the observed increases of GDP. The tight coupling between global energy use and GDP is explained by investments into energy efficiency. Policy efforts to decouple energy from GDP are therefore challenging if not futile. |
Several macro-economic models use (useful) exergy in addition to capital and labor as factors of production (Warr et al 2008, Warr and Ayres 2012, Santos et al 2018, Sakai et al 2019); these models can generally explain past GDP growth very well, without resorting to residual factors such as autonomous technological growth (Ayres and Warr 2009, Warr and Ayres 2012). This would explain the strong long-term coupling between useful exergy and GDP. Seen from that perspective, the decoupling of primary or final energy/exergy and GDP can be interpreted as an 'economic growth engine' under conditions of scarce resources (Ayres and Warr 2009, Sakai et al 2019). Raising the conversion efficiency of primary to final exergy or final to useful exergy then results in relative decoupling for the former properties while the ratio of useful exergy to growth does not improve substantially—in other words, increases in conversion efficiency drive GDP growth rather than reducing energy use (Ayres and Warr 2009, Sakai et al 2019).
3.3. Comprehensive measures of material and energy flows
Studies analysed in this section are based on the social metabolism concept (Fischer-Kowalski 1998); i.e. are studies that comprehensively trace flows of biomass, mineral resources, fossil fuels and many other materials respectively energy sources (Wiedenhofer et al 2020). In addition to fossil fuels used for the supply of technical energy, biomass used as food and feed also constitutes an important part of a society's energy metabolism (Haberl 2001). Material decoupling is also sometimes denoted as dematerialization (Bernardini and Galli 1993, Cleveland and Ruth 1998, Schandl and Turner 2009). We find very few dematerialization studies prior to the 1990 s (table 2). As also discussed in part I, many of these studies are concerned with compiling MEFA data (MEFA is an extension of MFA that consistently accounts for material and energy flows; see part I) rather than with advanced statistical or econometric analyses, and only 11 econometric dematerialization studies are in our sample of 835 articles.
Table 2. Analysis of the studies on material and energy flow indicators (MEFA). Production- vs consumption-based perspective is explicit through the definition of the indicators, the latter including RMC, MF, TMR, TMC. Acronyms: DE ... Domestic extraction; DMI ... Direct material input; DMC ... Domestic material consumption; DMF... Direct material flow; DPO...Domestic processed output; EE-IO...environmentally extended IO; GHG ... Greenhouse gas emissions; IO... Input output analysis; IPAT...Impact = Population × Affluence × Technogy; KEI ... Knowledge economy index; MF ... Material footprint; MI ... Materials intensity (e.g. DMC/GDP); MP... Material productivity (inverse of MI); NAS ... Net additions to stock; PPC... Public and private consumption; PPP...Purchasing power parity; PTB ... Physical trade balance; RMC...Raw material consumption; RME...Raw material equivalents; RP...Resource productivity (e.g. GDP/DMC); SDA...Structural decomposition analysis; TDO...Total domestic output; TEC... Technical energy consumption; TMC...Total material consumption; TMR ... Total material requirements; TPES ... Total primary energy supply; USA...United States of America.
| Distance of GDP and | ||||||
|---|---|---|---|---|---|---|
| Reference | Spatial reference | Period | Indicator(s) | Method(s) | resource growth | Interpretation |
| Kelly et al 1989 | USA | 1977–1987 | Material consumption | Descriptive | GDP grows 2.6%/year faster than consumption of energy & materials | Material consumption remained unchanged while GDP grew. Argued that efficiency of an economy is higher if its share of sectors extracting natural resources is lower. |
| De Bruyn and Opschoor 1997 | 19 countries | 1966–1990 | Material consumption (selected resources) | Descriptive | Varies by country | Material intensity decreases in almost all countries, but not as part of a development that can be expected to be persistent. |
| Picton and Daniels 1999 | Australia | 1970–1995 | Material consumption (selected resources) | Descriptive, per capita and per GDP | Materials used per GDP rise + 70%, consumption + 15% | Material consumption and production increased faster than GDP. |
| De Marco et al 2000 | Italy compared with others | 1994 | TMR and DMI | Descriptive | n.a. | Japan requires least materials (TMR) per unit GDP, US most. |
| Hoffrén et al 2001 | Finland | 1960–1996 | DMI | Descriptive and decomposition | Material productivity (GDP/mass) rises by 75%. | Relative decoupling for total GDP, but decomposition by economic sectors and materials gives varying results, including rebound effects in some sectors. |
| Bringezu et al 2003 | EU and other countries | Variable | TMR, MI, DMC, NAS | Descriptive | Variable | Relative decoupling found in most reviewed countries. Detailed information on the differences between TMR and DMI. |
| Canas et al 2003 | 16 industrialized countries | 1960–1998 | DMI | Panel regression with 15 different models | Differs between countries and regression model | Multiple model specifications provide good statistical fits for an inverted U-shaped EKC, but since most countries are still in the increasing stage, the evidence for an actual curve is lacking. |
| Ščasný et al 2003 | Czech Republic | 1990–2000 | DMI, DMC, TMR, TMC, DPO, TDO | Descriptive | DMC growth rate is smaller than that of GDP | Dissolution of Soviet Union and the Velvet Revolution in the Czech Republic led to a collapse and fundamental restructuring of the economy. |
| Bringezu et al 2004 | 16 countries | Variable | DMI, TMR | Descriptive and panel analysis | Varies by country and time period | No evidence for EKC. Provides analysis of country-level differences, e.g. population density, economic structure or public policy. |
| Cañellas et al 2004 | Spain | 1980–2000 | DMI, DMC | Descriptive | DMI + 85% DMC + 79% GDP + 74%. | Does not even find relative decoupling. |
| Krausmann et al 2004 | Austria | 1960–2000 | DMC | Descriptive | GDP + 250% DMC + 175% | Finds relative decoupling but total DMC grows by 175%. |
| Weisz et al 2006 | EU-15 | 2000 | DMC, DE, PTB | Descriptive, cross-sectional | n.a. | Compares economic structures vs. levels of GDP as determinants of DMC of material groups. |
| Behrens et al 2007 | 7 world regions | 1980–2002 | DE | Descriptive | Varies by world region | Rising DE despite improved efficiency; scale effects trump technology effects; highlights need for dematerialization in industrialized countries |
| Hoffrén and Hellman 2007 | Finland | 1970–2005 | DMF | Descriptive | DMF grows 1.7%/year less than GDP | Private consumption more strongly drives GDP than public expenditure does, but private consumption is linked to far lower material flows than public expenditure. |
| Schulz 2007 | Singapore | 1962–2003 | DMI, DMC | Descriptive, correlation | DMI grows 0.6%/year less than GDP, DMC − 1.9%/yearr | Argues that economic growth is not possible without material growth and that urbanization drives material use upwards. |
| Vehmas et al 2007 | EU-15 | 1980–2000 | DMI, DMC | Decomposition | For EU-15, Δ PPC 49.8, Δ DMC per capita − 3.1, Δ DMC/PPC -31.5 | Weak decoupling of resources from GDP; DMC shows more decoupling than DMI. |
| Xu and Zhang 2007 | China | 1990–2002 | TMR, DMC | Descriptive | TMR/GDP + 56%, DMI/GDP + 24% | No decoupling, both TMR and DMC grow faster than GDP. |
| Citlalic Gonzalez-Martinez and Schandl 2008 | Mexico | 1970–2003 | DMC, DMI, PTB, DE, DMC/GDP | Descriptive, decomposition (IPAT) | DMC + 194% GDP/cap + 62% | No dematerialization; population growth and exports drive material consumption over whole period; no efficiency gains of DMC/GDP since 1970. |
| Hashimoto et al 2008 | Japan | 1995–2002 | DMI | Decomposition | Growth rate of DMI is 3%/year smaller than GDP | Material intensity could be reduced by final demand structure and recycling; decline in construction reduces material intensity. |
| Kovanda and Hak 2008 | Czech Rep., Hungary, Poland, EU-15 | 1990–2002 | DMC, material productivity | Descriptive | Varies between countries | Relative decoupling resulting from structural and technological changes: material productivity (GDP/DMC) grew; absolute decoupling observed in the Czech Republic. |
| Kovanda et al 2008 | Czech Republic | 1990–2002 | DMC, DPO, NAS, TDO, TMR, TMC | Descriptive | Depends on indicator. | Indexed material intensity indicators decreased from 1 (1990) to 0.68–0.48, with a smaller decline of material outflow indicators. |
| Moffatt 2008 | G7 | 2000 | DMC, many other indicators | Cross-country analysis | n.a. | GDP is strongly negatively associated with DMC among the G7 countries |
| Schandl et al 2008 | Australia | 1970–2005 | DMC, DE, PTB | Descriptive | Resource productivity stable at 0.4 US$ PPP/kg | Australia's resource productivity is stable; it is only half of other OECD countries due to large raw material sector and inefficient domestic supply systems |
| Takiguchi and Takemoto 2008 | Japan | 2000–2005 | GDP/DMI | Descriptive | GDP per DMI rises by 25% | Growth of real GDP accompanied by a decrease in DMI |
| Muñoz and Hubacek 2008 | Chile | 1986–1996 | DMI | Structural decomposition analysis | DMI grew by 127%, GDP by 10%/year | GDP mainly driven by primary commodities (copper); declining ore quality drove up material intensity. |
| Krausmann et al 2009 | Global | 1900–2005 | DE = DMC | Descriptive | GDP growth factor: 22.8 DMC growth factor: 8.4 | Relative decoupling of DMC and GDP coinciding with large (factor 8) increase in material use. |
| Schandl and Turner 2009 | Australia | 1950–2011 | DMI | Descriptive | DMI growth factor: 10 GDP growth factor: 50 | Finds relative decoupling but strong growth of total DMI. |
| Wood et al 2009 | Australia | 1975–2005 | TMR | Econometric time-series analysis | Variable sectoral trends in TMR intensity per $ value added | Improvements in material intensity reduces growth of material flows. |
| Kovanda et al 2010 | Czech Republic | 1990–2006 | DMC, DMI, TMR | Descriptive | DMI − 23% DMC − 35% TMR − 27% GDP + 31% | Improved material productivity in this time period, related to accession to the EU but linked to increase in foreign trade, and less to transformations within the economy towards services |
| Schandl and West 2010 | Asia-Pacific and subregions (46 countries) | 1970–2005 | DE/cap, DMC, Material intensity (DMC/GDP) | Descriptive | Material intensity fluctuating around 2.4 kg US$−1 until 1990, then rising over 3 kg US$−1. | Resource use of the Asia-Pacific region is steadily growing and shows no signs of slowing down; no decoupling. |
| Steinberger et al 2010 | 175 countries | 2000 | DMC per capita, per area, per GDP for 4 material categories, Gini coefficient | Regression, STIRPAT | n.a. | Material consumption is unequally distributed, but less unequal than GDP. Material productivity is correlated with income, most strongly so for biomass. |
| OECD 2011 | China | 1997–2007 | RMC (MF) | Structural decomposition analysis | RMC + 71% | Material intensity decreases until 2002 and increases afterwards. |
| Kovanda and Hak 2011 | Czech Republic | 1918–2005 | DMC | Descriptive | DMC grows 2.8%/year less than GDP | Material productivity development could allow achieving a level comparable to that of the EU-15 as a consequence of structural/political change. |
| Krausmann et al 2011 | Japan | 1878–2005 | DMC, DE, import, export, TPES | Descriptive | Overall GDP growth factor is 97, for DMC 49 | Japans DMC peaked in 1973 and fell afterwards (absolute decoupling); 2005 one of the lowest DMC/cap among high income countries; but almost 50% of DMC from imports—MF likely much higher. |
| Steger and Bleischwitz 2011 | EU15/EU25 | 1980–1992–2000 | DMC | Panel analysis | n.a. | The main drivers of resource use are energy efficiency, new dwellings and road construction. |
| Steinberger and Krausmann 2011 | 150 countries | 2000 | DMC | Regression | n.a. | Ratios of GDP:DMC vary between materials; biomass is independent of income, but use of fossils, minerals and ores depends on GDP. |
| Weinzettel and Kovanda 2011 | Czech Republic | 2000–2007 | RMC | Structural decomposition analysis | GDP grows by 36%; RMC by 9% | Technology-driven gains in resource efficiency cannot compensate for rising consumption due to GDP growth (crude oil, metal ores, construction materials, food crops, timber) |
| Haberl et al 2012 | >140 countries | 2000 | Various resource use indicators | Regressions | DMC correlates well with GDP; final biomass use even more strongly. | Shows that indicators such as biomass consumption and total DMC are strongly correlated with GDP (r20.7). |
| Nita 2012 | Romania | 2000–2007 | Many resource use indicators | Descriptive | MI increased from 2.4 to 3.9 t lei−1; RP decreased from 0.17 to 0.12 € kg−1. | Romanian GDP grew on average by 2.2%/year while material consumption inceased at a faster rate; hence no decoupling. Energy use remained more or less constant. |
| Schandl and West 2012 | China, Australia, Japan | 1970–2005 | DE, PTB, DMC, MI | Descriptive, decomposition (IPAT) | MI decreased by 60% in Japan and 40% in China | No decreases in MI in raw material exporting Australia, but improvements in importing countries; picture would change when looking at MF. |
| Yabar et al 2012 | China, Japan | 2000–2010 | GDP/DMI | Descriptive | RP of DMI rises by 40% | Relative decoupling of GDP from DMI |
| Gan et al 2013 | 51 countries | 2000 | DMC | Descriptive, cross-country | Resource productivities (dollar/kg) for all country-subgroups, from 0.25 to 1.5 | GDP per capita, economic structure and population density are the three factors with the greatest contribution explaining resource productivity |
| Wang et al 2013 | China | 1995–2008 | TMR | Decomposition | TMR: 4.4%/year, GDP 8.9%/year | Relative decoupling of TMR from GDP. |
| West and Schandl 2013 | Latin America and Caribbean | 1970–2008 | DMC/GDP | Descriptive | MI increased from 2.6 to about 2.9 kg $−1. | Latin America and the Caribbean had a high MMI compared to the rest of the world in 1970; MI grew until 2008 while MI decreased globally. High intensities in Chile and Peru linked to non-ferrous metal exports. |
| Steinberger et al 2013 | 38 countries | 1970–2004 | DMC, fossil CO2 | Panel analysis, cluster analysis | Differs among countries. | Absolute long-term decoupling of DMC for Germany, UK, Netherlands and some others; EKC-like behavior observed for CO2 in 'mature' economies, emerging countries have higher long-term coupling of GDP and materials |
| Yu et al 2013 | China | 1978–2010 | DE, TEC, CO2 | Decomposition | Growth rates 1978–2010: GDP: *19.5, DE *4.5, TEC *4.7 | Authors found relative decoupling between GDP and DE and GDP and TEC. |
| West et al 2014 | Eastern Europe, Caucasus, Central Asia | 1992–2008 | DMC, DMC/cap, PTB, PTB/cap, MI | Descriptive, decomposition (IPAT) | MI falls by 2.8%/year | Very high MI after dissolution of Soviet Union, strongly falling MI afterwards during high GPD growth. |
| Lee et al 2014 | South Korea | 2000–2010 | DMC | Descriptive | DMC increased by 8%, GDP by > 50% | Absolute decoupling; DMC falls, and increases in resource productivity are very high; authors claim this was due to resource management policies. |
| Raupova et al 2014 | Uzbekistan | 1992–2011 | DMI, DMC, TMR, CO2 | Descriptive | DMI + 2.8%/year TMR + 2.3%/year GDP: + 4%/year | Relative decoupling, material efficiency (GDP/DMI) increased. |
| Fishman et al 2014 | USA, Japan | 1930–2005 | DMC, Material Stock, Removal from Stock | Descriptive | Since 1960 s, DMC productivity *2 in USA, *2.5 in Japan. Stock productivity *2 in USA, *6 in Japan | Analyzed coupling of DMC, material stocks, and GDP from 1930 to 1970 s. In US relative decoupling since 1970 for DMC and weaker decoupling for stocks. In Japan relative decoupling only for DMC, not for stocks. |
| Wang et al 2014 | Taiwan | 1993–2012 | DMC, DMI, DPO | Descriptive | DMI grew by 2.8%/year, DMC by 2.1%/year and GDP by 5%/year on average over period | Relative decoupling: DMI and DMC grew less than GDP. |
| Infante-Amate et al 2015 | Spain | 1860–2010 | DMC | Descriptive | Material intensity −86% | Relative decoupling; structural breaks in the rate of decoupling in 1880, 1940, and 1980, coinciding with historical events. |
| Maung et al 2015 | Myanmar, Philippines, Bangladesh | 1985–2010 | DMC | Decomposition (IPAT) | Material intensity falls in all three countries | Decreasing material intensities due to improved technological efficiency. |
| Pothen and Schymura 2015 | Global | 1995–2008 | DE | Decomposition | GDP + 59% DE + 56% | No evidence for global dematerializetion; GDP growth is the strongest factor behind growing material use. |
| Wenzlik et al 2015 | AUT | 1995–2007 | RMC | Structural decomposition | n.a. | Generally, GDP growth drives RMC; during phases of low economic growth, the composition of consumption trends towards inefficient products and services. |
| Wiedmann et al 2015 | 186 countries | 1990–2008 | Material footprint MF, DMC | EE-IO, descriptive trend analysis; cross-country regression | For 1% GDP growth, MF rises by 0.6%, DMC by 0.15% | No increases in resource productivity for developed countries in last decades; relative decoupling of DMC and GDP, little or no decoupling of MF and GDP. |
| Krausmann et al 2016 | Russian Federation and its predecessors | 1900–2010 | DMC for material groups, MP | EW-MFA, descriptive | MP of biomass grew strongly, growth/decline phases for MP of fossils and minerals. | Overall, relative decoupling: GDP grew 10 times faster than DMC/cap early on, growth rates declined thereafter. Material productivity (GDP/DMC) grew fast in stagnation phase (1978–1991) and collapse phase (1992–1998). |
| Ward et al 2016 | 6 countries | 1990–2010 | Total material use | Descriptive | Varies by country | Argue that growth in GDP cannot be decoupled from material and energy use. |
| Bithas and Kalimeris 2017 | World | 1900–2010 | DE for non-combustible materials | Descriptive | GDP/DE rises by 2%/year, GDP/(cap*DE) by 0.7%/year | Relative decoupling; decoupling rates are smaller when dividing per-capita DE by total GDP as a result of population growth. |
| Chiu et al 2017 | Philippines | 1980–2008 | DMC | Descriptive; decomposition (IPAT) | No significant change throughout the period. | Slight decoupling is due to recessions and economic crises, no robust decoupling. |
| Krausmann et al 2017b | World | 1900–2010 | DE, material stocks | Descriptive | GDP grew 27-fold, DE grew 11-fold, stocks grew 23-fold | Finds relative decoupling between global material use and GDP but no decoupling between material stocks and GDP. |
| Kallis 2017 | Global | 1980–2014 | DE = DMC | Descriptive | DMC + 110% GDP + 150% | Claims that the current economic system cannot lead to the required 'radical' level of dematerialization. |
| Krausmann et al 2017a | Global | 1980–2010 | DMC, MP | Descriptive | Growth factor of DMC was 8, that of GDP 20 | Relative decoupling slowed after 2002; currently re-materialization due to fast industrial and urban transition in the Global South, shifts of economic activity to less resource efficient countries and growing levels of consumption. |
| Martinico-Perez et al 2017 | Philippines | 1985–2010 | DMC | IPAT | GDP + 200% DMC + 100% | Aggregate indicators (national DMC, GDP etc) hide large inequalities between small elites and the majority of the population. |
| Pothen 2017 | Global and 40 countries | 1995–2008 | RMC (MF) | Decomposition (LMDI) | Global RMC rises by + 44% | Material intensity decreases (relative decoupling). |
| Shao et al 2017 | 150 countries | 1970–2010 | DMC for 4 material categories | Dynamic panel data model | DMC growth factor 2.9 GDP growth factor 3.8. | Relative decoupling at the global level until early 2000 s, then GDP and DMC grow in unison until 2009. Short absolute decoupling 1990–1992. |
| Wang et al 2017 | China, provinces | 2002–2012 | Material use, similar DMC | Decomposition (LMDI) | n.a. | Two thirds of the Chinese provinces show no decoupling, 9 provinces relative decoupling, absolute decoupling in Shanxi and Shanghai. GDP growth strongest driver of material use. |
| Zhao 2017 | China | 1978–2008 | DMI | Descriptive | Growth factor of DMI 5.6, GDP 16.5, GDP/DMI 2.9 | Material efficiency improved dramatically until 2000 but fluctuated around a flat line since then. |
| Bithas and Kalimeris 2018 | World | 1900–2009 | DE | Descriptive | GDP/DE grows by 3%/year; GDP/(DE*cap) by 0.7%/year | Relative decoupling of GDP from DE, but not on a per-capita basis. |
| Bleischwitz et al 2018a | Germany, China, US, UK, Japan | Varied | Apparent Domestic Consumption | Descriptive | n.a. | Studied countries have achieved a saturation stage for key materials (steel, copper, cement); stock-building seems to saturate as well. |
| Martinico-Perez et al 2018 | Philippines | 1980–2014 | DMC | Descriptive | DMC grows 0.5%/year less than GDP | Improved resource efficiency due to growing service sector, greater material efficiency of industry, and technology improvements. |
| Meyer et al 2018 | Global | 1980/2015 | DE (4 material categories) | Descriptive | Depends on indicator | Overall finds relative decoupling on a global level but fossil fuels rose in parallel to GDP since 2000 s; ores and minerals rise faster than GDP. |
| Plank et al 2018 | Global and 9 regions | 1990–2010 | RMC, MF | Structural decomposition analysis (SDA) | global RMC + 87% | Relative decoupling: material intensity decreases but raw material consumption keeps growing. |
| Schandl et al 2018 | Global, sub-regions | 1970–2010 | DMC, DMI, PTB, DE, RME of trade, MF, RMC, DMC/GDP | Descriptive, Decomposition (IPAT) | Material intensity remains largely constant. | Material intensity of global economy (kg $−1) almost stable from 1970 to 2010, global material footprint per capita has been growing from 1990 to 2010. Main drivers of growing material use are GDP and population growth. |
| Vuta et al 2018 | EU-28 | 2005–2016 | GDP/DMC | Panel data analysis (level-level model) | Resource productivity growth of 1 unit leads to a change in GDP growth rate of 0.75% | Finds a positive relationship between real GDP growth and resource productivity. |
| Wood et al 2018 | Global | 1970–2008 | DMC | Panel analysis, decomposition | n.a. | Besides population and affluence, other socio-economic variables do contribute little to explain DMC variations across countries—nation as inappropriate unit of analysis |
| Wood et al 2018 | Global | 1995/2011 | Global DE, GHG, others | Descriptive; IO; regional comparison | Global DE grows + 36%, i.e. faster than GDP | No decoupling; material use grows fastest among all indicators (GHG, energy, blue water, land use); flows embodied in trade are growing and result in displacement to developing regions. |
| Fernández-Herrero and Duro 2019 | 94 countries | 1990–2010 | DMC | Econometric timeseries anal. | Material productivity increased by 31% | Material productivity increased over time, but also inequalities in MP growth between countries increased. |
| IEA 2019 | 2 countries each from BRICS, OECD | 2000–2007 | DE | Decoupling indicators derived from IPAT | Differs between countries | Absolute decoupling in Japan and for some time in the US; relative decoupling in US, Russia and China. It is argued that absolute decoupling in OECD countries is due to their lower GDP growth rates. |
| Rezny et al 2019 | 130–40 countries | 1995–2012 | MF, KEI | Descriptive | n.a. | No significant link between innovation (measured by the knowledge Economy Index KEI) and resource efficiency. |
| Wu et al 2019 | 157 countries | 1980–2011 | DMC | Descriptive | DMC grows 1.25% less than GDP | Absolute dematerialization occurred only during periods of recession or low economic growth. |
Long time series of harmonized MEFA data now enable researchers to analyse the interplay between political-economic and material development of countries. Especially at the national level, this analysis commonly analyse how trajectories of material use relate to major phases of socioeconomic or political development, including incisive political events such as the dissolution of the Soviet Union (Krausmann et al 2016) or China's admittance to the World Trade Organisation (Velasco-Fernández et al 2015). At the country level, decomposition analyses (Muñoz and Hubacek 2008, Wenzlik et al 2015, Plank et al 2018) have identified economic growth (of absolute or per capita GDP and/or monetary final demand) as the most important driver of consumption-based measures of resource consumption. (Yu et al 2013) identified technological progress as the most important driver for China, while other drivers were found to have no significant impact on resource use (e.g. Rezny et al 2019 for innovation). The links between GDP growth and material use are also the subject of global studies, covering either aggregated world regions (Behrens et al 2007, Schaffartzik et al 2014) or representative large (> 100) samples of countries (e.g. Steinberger and Krausmann 2011, Steinberger et al 2013, Pothen 2017). At the global scale, a period of relative decoupling after the 1970 s was followed by a period starting 2000 in which global material use accelerated at a similar pace as GDP (Krausmann et al 2018). While many of the studies analyzed in this section apply production-based accounting principles, a substantial and rising fraction analyze resource flows from a consumption-based (or 'material footprint'; Wiedmann et al 2015) perspective.
From country case studies based on simple data description to advanced statistical analyses of global samples, relative decoupling has been identified mainly for regions or countries with intermediate economic growth (e.g. USA, European countries) or in countries that experienced socio-economic and political turmoil with corresponding restructuring of their economies (Kovanda and Hak 2007, Raupova et al 2014). Absolute reductions of material flows are generally only found in periods of very low economic growth or even recession (Steinberger and Krausmann 2011, Shao et al 2017, Wu et al 2019). Accelerated industrialization and high rates of economic growth, as observable in China in the last decades, often coincide with a growth of material use matching or even outstripping economic growth (Xu and Zhang 2007). The post-World War II boom in the world's wealthiest economies is not widely analysed, with most studies relying on data that does not reach further back than 1970. Hence there is little opportunity to compare the rapid growth phase in the 1950 s found by long-term studies (e.g. Krausmann et al 2011, Gierlinger and Krausmann 2012, Infante-Amate et al 2015) with the currently similarly high growth rates in some countries. Better understanding the role of such rapid growth phases for the following phase of slowed growth in domestic extraction and production in the 1970s (Schaffartzik et al 2014, Giljum et al 2014b) would be beneficial.
At the same time, it appears that reductions or stagnation in the use of the domestic resource base is often associated with rising importance of trade. In contrast to those measures of decoupling based on territorial indicators, consumption-based perspectives unveil a reversal of trends with efficiencies deteriorating instead of improving and no evidence even for relative decoupling (Giljum et al 2014a, Pothen and Schymura 2015, Wiedmann et al 2015). The integrated, more holistic perspective achieved by considering trade-offs over longer periods as well as across spatial scales is important in assessing the possibilities of and necessary conditions for any future (relative or absolute) decoupling. Currently, decoupling appears to depend on prior use and accumulation of materials and on extractive expansion and rising material flows elsewhere. As long asthis is the case, decoupling cannot be achieved in the long-term or universally.
3.4. (De)coupling GDP from total GHG emissions
Reporting of territorial CO2 emissions from fossil fuel combustion and industrial processes such as cement manufacture is rather straightforward because these emissions can be calculated stoichiometrically from fuel use respectively cement production data. These emissions have been reported for a long time, and are readily available from sources such as CDIAC (Carbon Dioxide Information Analysis Center, https://cdiac.ess-dive.lbl.gov/) for many countries and the global total. Hence, there is a large literature on the decoupling of GDP from territorial CO2 emissions (section 3.1). By contrast, full GHG accounts also need to quantify emissions from land-use and land-cover changes (LULUCF) as well as highly uncertain and strongly context-dependent emissions such as those of CH4 and N2O. The quantification of 'carbon' respectively GHG footprints (i.e. consumption-based accounts of carbon or GHG emissions) started a bit over a decade ago (Peters and Hertwich 2008, Hertwich and Peters 2009, Peters et al 2011, Lenzen et al 2013),12 and up to now these studies generally include only fossil-fuel and industrial-process related emissions, whereas LULUCF emissions of carbon (i.e. changes of the carbon balance of ecosystems resulting from land use, land-use change or forestry) are not systematically accounted for in these databases.
Table 3. Analysis of the studies on GHG emissions and CO2 footprints. Acronyms: BRICS...Brasil, Russia, India, China, South-Africa; DEA... Data envelopment analysis; EEA...European environment agency; EKC...Environmental Kuznets curve; EU...European Union; EXIOBASE...Acronym of an multi-regional environmentally extended input-output database; GHG...Greenhouse gas; IDA...Index decomposition analysis; IPAT...Impact = Population × Affluence × Technology; LMDI...Logarithmic mean divisia index; LULUCF...Land use, land use change, and forestry; MARKAL...Market allocation model; MRIO...Multi-regional input-output analysis; OECD...Organization of economic co-operation and development; RoW...Rest of the world; UNFCCC...United Nations framework convention on climate change; UK...United Kingdom; USA...United States of America; WIOD...World input output database.
| Reference | Country | Period | Territorial or footprint | Indicator(s) | Method(s) | Interpretation, including quantitative measures of decoupling (if available) |
|---|---|---|---|---|---|---|
| Li et al 2007 | 77 studies, 588 observations | 1992–2005 | Presumably territorial | CO2, full GHG | Meta-analysis of EKC studies | No reliable EKC observed regarding CO2 and/or GHG emissions; specifically no income turning point identified, even though studies report EKC. |
| Lozano and Gutiérrez 2008 | USA, compared to Kyoto protocol Annex I | 1990–2005 | Territorial | Primary energy, total GHG emissions excluding LULUCF | Data Envelopment Analysis (DEA) | DEA compares different countries and estimates GHG reductions that would result from application of 'best practice'; e.g. GHG emissions of the USA could be lowered by 60% even at 3% GDP growth rates by adopting the best efficiency in the country sample. |
| Faehn and Bruvoll 2009 | Norway | 1980–2000 | Footprint | GHG emissions excl. LULUCF | Calculation of emission 'leakages' using emission coefficients | Finds relative decoupling between GDP and GHG emissions. Net leakages (GHG related to export subtracted) declined. |
| Baiocchi and Minx 2010 | UK | 1992–2004 | Territorial, footprint | CO2 | MRIO, decomposition | Territorial improvements in CO2 emissions overcompensated by supply-chain emissions; local decoupling, but not at global scale. |
| Guillet 2010 | OECD countries | 1970–2001 | Territorial | Primary energy, GHG emissions | Graphical analysis of trajectories | Plots data showing that GHG emissions rose by a factor of 1.4, primary energy 1.5 and GDP 2.5 in the OECD. |
| Koirala et al 2011 | 878 observations, 103 studies | 1992–2009 | Various | CO2 and others | Meta-analysis of EKC studies | Turning point at ten times current world GDP/cap, i.e. outside observational space, concludes that there is no EKC for CO2. |
| Angelis-Dimakis et al 2012 | Greece | 1960–2007 | Territorial | Primary and final energy, GHG emissions | Sustainability analysis relating trajectories of various indicators | GHG emissions rose over the entire period with declining growth rates towards the end of the period. GHG/GDP was highest 1990–2000 and declined somewhat thereafter |
| Duarte et al 2013 | 11 industrial countries | 1995–2005 | Footprint | CO2 emissions | MRIO, decomposition | Technological efficiency improvements are overcompensated by growing demand. |
| West et al 2013 | China | 1979–2008 | Territorial | GHG emissions | Trend analysis | CO2 intensity of GDP more than halved between 1970 and 2005, still much higher than in many other countries |
| Arto and Dietzenbacher 2014 | Global | 1995–2008 | Territorial and footprint | GHG | Structural decomposition analysis | Consumption is the main driver of global GHG emission increase. |
| Knight and Schor 2014 | 29 high-income countries | 1991–2008 | Territorial and footprint | CO2 emissions excluding LULUCF | Various econometric panel analysis methods | GDP growth has a positive effect on both territorial and consumption-based emissions. Relative decoupling exists for territorial but not for consumption-based CO2. |
| Xu et al 2014 | China | 1996–2011 | Territorial | GHG from fossil energy use | LMDI decomposition analysis, 5 sectors | GHG emissions more than doubled, and GDP growth was the most important driver; energy intensity improvement was the most important counteracting factor. |
| Jesus Lopez-Menendez et al 2014 | EU27 | 1996–2010 | Territorial | GHG emissions from Eurostat | Panel analysis based on the EKC concept | Finds different shapes of the EKC; the inverted U shape is only found in 4 out of 27 countries |
| Gupta 2015 | OECD member countries | 1999–2012 | Territorial | Primary energy, CO2 emissions, GHG emissions | Descriptive trend analysis | Descriptive study analyzing the relations between a multitude of environmental or biophysical indicators and GDP in the OECD. Nominal GDP rose 4% faster than GHG emissions. GHG remained largely constant despite noticeable GDP growth. |
| Robaina-Alves et al 2015 | EU 27 | 2000–2011 | Territorial | Total GHG emissions from EEA | Stochastic frontier and max. entropy models | Benchmarks countries in terms of their eco-efficiency (GPD/GHG), considering inputs such as capital, labor, fossil & renewable fuels |
| Solilová and Nerudová 2015 | Czech Republic | 1990–2011 | Territorial | GHG emissions from Eurostat | Descriptive trend analysis | Finds relative decoupling (falling emission-intensity and energy-intensity) of the Czech economy |
| Cruz and Dias 2016 | EU-27 | 1999–2009 | Territorial and footprint | Unspecified CO2 and energy indicators | Index decomposition analysis (LMDI) using WIOD data | EU-27 overall slightly reduced energy use and CO2 emissions by moving into less energy/CO2-intensive structures and improving sectoral energy/CO2 efficiency; GDP growth did counteract but not annihilate efficiency improvements. |
| Gazheli et al 2016 | Denmark, Germany, Spain | 1995–2007 | Territorial and footprint | Sectoral CO2 emissions (unclear definition of processes) | Input-output analysis (WIOD data); correlation analysis | Analyses efficiency, structural effects and consumption on a sectoral level; finds no robust trends towards green growth (e.g. technological change or structural change in demand); stresses the need for systemic solutions. |
| Grand 2016 | Argentina | 1990–2012 | Territorial | Full GHG emissions | Trend analysis based on a systematic distinction of different meanings of decoupling | The main contribution of this paper is to clarify various meanings of weak and strong decoupling; argues for a focus on absolute reductions of emissions instead of decoupling, which is no robust concept for unstable economies. GDP grew 1.9%/year faster than GHG |
| Fan et al 2016 | 14 countries and RoW | 1995–2009 | Territorial and footprint | CO2 from fossil fuels & industrial processes | Multi-Regional Input-Output analysis based on WIOD | Production-based accounts of CO2 emissions reveal large variation of CO2/GDP ratios (all countries plotted in one graph); consumption-based accounts reveal a monotonously positive relation of CO2/GDP ratios, with some national-level exceptions. |
| Lenzen et al 2016 | Australia | 1976–now (2050) | Footprint | GHG emissions (system boundary not clearly specified) | Structural decomposition analysis of past data and scenario studies | Commentary-style article presenting a reanalysis of published past and scenario data; questions whether technological change can suffice to realize these scenarios. |
| Liang et al 2016 | USA | 1995–2009 | Territorial, consumption, income | GHG | Structural decomposition analysis | Absolute decoupling of territorial GHG emissions: found a 3% reduction in emissions while GDP increased by 42% |
| Liobikiene et al 2016 | Baltic states | 1990–2012 | Territorial | GHG | Decomposition analysis (Divisia IDA) | Collapse of GHG emissions after 1990. Since then slow increase of GHG emissions with economic recovery. Investments of RE correlated with relative decoupling. |
| Kerimray et al 2016 | Kazakhstan | 1990–2010 (scenarios 2030) | Territorial | GHG emissions (UNFCCC), Total primary energy supply | Data analysis for past trajectories, MARKAL for future scenarios | Main focus of the paper are future scenarios. Analysis of data for 1990–2010 is mainly focused on the crisis caused by the breakdown of communism in the Former Soviet Union. GHG intensity of GDP fell from 3.4 kg $−1 to 2.0 kg $−1 |
| Sanchez and Stern 2016 | 129 countries | 1971–2010 | Territorial | CO2 from fossil fuel & cement; non-industrial GHG | Nested statistical model combining EKC, IPAT and convergence approaches | No support for EKC hypothesis. GDP growth drives both industrial CO2 and other GHGs, but its effect on industrial CO2 is twice that of other GHGs. The time effect is negative for both industrial CO2 and other GHGs, but the former effect is stronger than the latter. |
| Streimikiene and Balezentis 2016 | Bulgaria, Estonia, Latvia, Lithuania, Luxembourg | 2004–2012 | Territorial | GHG emissions (no clear definition) | Index decomposition analysis using the Kaya identity | Energy intensity and economic growth are the main drivers of GHG per capita. GHG emissions per capita increased despite improved energy efficiency, among others due to higher C intensity of energy. |
| Valadkhani et al 2016 | 45 countries | 2002, 2007, 2011 | Territorial | Primary energy, CO2, CH4 and N2O | Multiplicative environmental data envelopment analysis (ME-DEA) | Efficiency scores rise over time for most countries. There is a positive relation between energy efficiency and economic efficiency. Abundant natural and energy resources result in inefficient use. |
| Bampatsou et al 2017 | EU (11 countries) | 1990–2011 | Territorial | GHG emissions | Data envelopment analysis | Relative decoupling in some countries, absolute decoupling in others. |
| Beltran-Esteve and Picazo-Tadeo 2017 | EU | 2000–2014 | Territorial | GHG emissions | Data Envelopment Analysis | Provides efficiency rankings; emphasizes the role of technological innovation, and catch-up in technology adoption in East Europe for reducing GHG emissions. |
| Drastichova 2017 | EU-15 | 2000–2013 | Territorial | GHG | Decomposition with Log-Mean Divisia Index | Absolute decoupling, as GHG intensity reduced faster than increase of economic activity (scale) |
| Fernandez-Amador et al 2017 | Global | 1997–2011 | Territorial and Footprint | CO2 | Threshold models | Finds no support for EKC with up-to-date database. Income elasticity of production-based emissions was 0.6; of consumption-based emissions 0.8 |
| Liobikiene et al 2017 | Lithuania, EU-27 | 2000–2012 | Territorial | GHG | Elasticity coefficient methods | Relative decoupling in Lithuania; absolute decouling in EU-27 in some sectors |
| Mi et al 2017 | China | 2005–2012 | Territorial and Footprint | CO2 emissions | Structural decomposition analysis | No decoupling; in different years varied contributions of emissions growth from consumption, production, etc |
| continue | ||||||
| Khan et al 2017 | 36 countries | 2001–2014 | Territorial | GHG emissions | Granger causality | Investigates multi-causalities also with trade and urbanization; finds that GHG emissions are positively influenced by financial development, urbanization, trade openness and energy consumption. |
| Shuai et al 2017 | Global | 1960–2011 | Territorial | GHG emissions | Panel analysis of EKC hypothesis for all countries worldwide | Predicts that the global economy will reach its turning point around 2050 and will absolutely decouple thereafter |
| Simas et al 2017 | Global | 2007 | Territorial and Footprint | GHG emissions | EXIOBASE | Decoupling found for production-based emissions, not for consumption-based emissions |
| Yang et al 2017 | Russia | 1998–2013 | Territorial | GHG | Fitting detailed emissions data with EKC | Predicts an EKC-turning point for Russia in about 2027; absolute decoupling from thereon. |
| Zaman et al 2017 | Sub-Saharan Africa | 2000–2014 | Territorial | CO2 and GHG emissions | Panel random effect | EKC confirmed for CH4; emphasis on relevance of food sector. |
| Bluszcz, 2019 | 8 EU countries, specifically Poland | 2006–2015 | Territorial | GHG emissions | Descriptive trend analysis, Pearson correlation | Absolute decoupling observed |
| Cohen et al 2018 | 20 largest emitters | 1990–2014 | Territorial and footprint | GHG emissions | Estimation of trends elasticity, Hodrick-Prescott filter | Absolute decoupling in European countries, not in emerging economies; absolute decoupling weaker but still existent from consumption perspective; renewable policies support decoupling. |
| Bader and Ganguli 2019 | Gulf cooperation council countries | 1980–2006 | Territorial | GHG emissions | Granger causality and other statistical tests | Mostly lack of EKC in gulf states; reduced fossil fuel consumption recommended to improve health. Oil rentier states may work categorically different than other countries [interpretation added]. |
| Bampatsou and Halkos 2019 | G7 countries | 1993–2016 | Territorial | GHG emissions (not clearly specified) | Non-parametric Data Envelopment Analysis | Calculate elasticities of GDP to changes in various variables, including GHG emissions, and evaluate trends in efficiencies. |
| Cohen et al 2019 | China | 1950–2012 | Territorial and Footprint | GHG emissions | Descriptive trend analysis | Kuznet elasticity 0.6 for production-based emissions, a bit lower for consumption-based emissions. Emissions in China result partially from being a pollution haven; long-term trend indicates potential for absolute decoupling. |
| Fanning and O'Neill 2019 | 120 countries | 2005–2015 | Footprint | GHG emissions | Descriptive data analysis | Decoupling insufficient; either decouple more strongly, or decouple happiness from consumption. |
| Leal et al 2019 | Australia | 1990–2015 | Territorial | Sectoral GHG emissions from national inventory | LDMI decomposition, decoupling and efficiency indices | GHG emissions decrease and increase throughout the period in waves while GDP grows. At the end of the period, GHG are slightly lower than in the start year (absolute decoupling), largely explained by reduced emissions in agriculture. |
| Le Quéré et al 2019 | 79 countries | 2005–2014/15 | Territorial, footprint | CO2 | Spearman's rank, LMDI | 18 countries show absolute decoupling of industrial CO2 and GDP in both territorial and footprint accounts (see text). |
| Liu et al 2019 | 40 countries | 1995–2009 | Footprint | GHG emissions excl. LULUCF | WIOD and structural decomposition analysis | Rising consumption generally drives up emissions, while reductions of emissions intensities somewhat counteract that trend (relative decoupling). Finds rising volumes of GHG 'embodied' in products exported from developing countries. |
| Palm et al 2019 | Sweden | 2008–2014 | Footprint | Fossil-fuel CO2, CH4, N2O, F-gases | Hybrid MRIO, descriptive trend analysis | Absolute decoupling: consumption-based GHG emissions decreased in absolute terms, mainly due to reduced emission intensities of households, while consumption-based value added increased. |
| Sarkodie et al 2019 | Australia | 1970–2017 | Territorial | GHG emissions (World Bank) | Autoregressive Distributed Lag simulations | Finds an inverse U-shaped relationship between energy use and GDP and declining GHG intensity of GDP. |
| Wang et al 2019 | China, G20 | 2000–2014 | Territorial | GHG emissions | Hybrid Malmquist–Luenberger index, meta-frontier technique | Efficiency increase larger in BRICS countries than in G20 advanced group. |
Five studies (Lozano and Gutiérrez 2008, Valadkhani et al 2016, Bampatsou et al 2017, Beltran-Esteve and Picazo-Tadeo 2017, Wang et al 2019) use Data Envelopment Analysis techniques, a method providing efficiency rankings of countries, which show that most countries could reduce their emissions if catching up with the most efficient ones, but does not directly deliver insights on decoupling. Studies searching for an EKC often find no indication for the existence of a turning point (Li et al 2007, Koirala et al 2011), not even a large-scale study of 129 countries (Sanchez and Stern 2016) as well as a global study (Fernandez-Amador et al 2017). A study of 27 EU countries found differently shaped EKCs, but only four countries with an inverted U shape (Jesus Lopez-Menendez et al 2014). A study on Australia 1970–2007 found some evidence for an EKC related to energy, and a declining trend for GHG per GDP (Sarkodie et al 2019). Another study predicts an EKC for Russia (Yang et al 2017), another an EKC for CH4 for Sub-Saharan Africa (Zaman et al 2017). Overall, however, there is little support for the inverted U-shape hypothesis.
A considerable number of studies used descriptive trend analyses, generally finding relative decoupling, for example for the OECD 1970–2001 (Guillet 2010), the Czech Republic (Solilová and Nerudová 2015) and China (Cohen et al 2019). A study of OECD countries covering 1999–2012 found that GHG emissions were constant while GDP grew on considerably (Gupta 2015). A study for Greece (Angelis-Dimakis et al 2012) found that GHG emissions were highest around the year 2000 and then declined somewhat. Decomposition analyses generally find GDP to be an upward driver of GHG emissions. For example, Duarte et al (2013) find that GDP-induced demand growth overwhelmed technology-induced GHG emission reductions in 11 industrialized countries 1995–2005; similar results were reported for the Baltics (Streimikiene and Balezentis 2016). Xu et al (2014) show that in China 1996–2011, GDP growth was the most important driver of rising emissions. By contrast, from 1999–2009 the EU-27 overall slightly reduced energy use and CO2 emissions through structural change and improved energy/CO2 efficiency; GDP growth counteracted but not annihilated these efficiency improvements (Cruz and Dias 2016). In Australia, total GHG emissions have been slightly reduced, whereas industrial CO2 emissions continued to increase, which was achieved by reductions in LULUCF/agricultural emissions (Leal et al 2019). Econometric studies are rare, examples include Knight and Schor (2014), Khan et al (2017), Bader and Ganguli (2019).
Footprint studies often find that territory-based emissions grow more slowly or even fall while consumption-based emissions increase (e.g. UK 1992–2004, see Baiocchi and Minx 2010; global: Simas et al 2017). There are, however, necessarily also countries where the situation is reversed, e.g. Norway 1980–2000 (Faehn and Bruvoll 2009). In 29 high-income countries for the period 1991–2008, GDP was found to drive both territorial and consumption-based emissions; relative decoupling existed for territorial but not for consumption-based CO2 (Knight and Schor 2014).
Decoupling was found to be insufficient for reaching climate targets in a study of 120 countries for 2005–2015 (Fanning and O'Neill 2019). Absolute decoupling is found in a footprint-study of GHGs for Sweden 2008–2014 (Palm et al 2019). Most noteworthy is a study of 18 countries with declining CO2 emissions (both consumption and production-based) that is discussed in more detail in section 5 (Le Quéré et al 2019). Overall, the studies summarized in table 3 suggest that very recently, absolute decoupling between GDP and CO2 or GHG emissions can be found in some countries, but even in those cases decoupling is so far insufficient to address stringent climate targets, and it is driven by policies promoting renewable energy and energy efficiency (Le Quéré et al 2019).
4. Strategies for decoupling—green growth versus degrowth
In order to elucidate the perspective on economic growth adopted in empirical decoupling studies, we assessed a random sub-sample of 15% of the 835 articles in terms of their political or strategic assumptions and/or conclusions, as visible in their introduction and conclusions sections respectively the policy-recommendations given (if available). Due to the search query, this body of literature contained only quantitative, empirical studies of decoupling and excluded qualitative policy analyses. Hence almost none of the 125 selected articles focused primarily on strategies or policies for a zero-carbon society and the strategic conclusions or policy recommendations drawn from the quantitative analyses are often rather formulaic. 31% of the articles mentioned no strategies or policy recommendations at all, while 69% provided policy recommendations or strategic conclusions in varying detail.
With regard to their overall framing and aims, 64% of the analyzed articles followed a green growth perspective, that is, they aimed at analyzing absolute or relative decoupling in a given period and territory, and provided policy recommendations in this direction. In line with the literature, a green growth perspective is mainly concerned with 'making growth processes resource-efficient' (Hallegatteet al 2011, p 2) and 'stimulating demand for green technologies, goods, and services' (OECD 2011, p 5), but presents economic growth (measured as increase of GDP) as a set variable. Interestingly, this framing was also common in articles that did not find empirical evidence for absolute decoupling, implying that these studies at least implicitly valued continuation of GDP growth higher than achieving set environmental goals. Only 3% of the articles adopted a degrowth perspective and were open to question the primacy of economic growth. These 'degrowth' studies usually did not explicitly argue in favor of reducing GDP growth; they rather questioned to what extent it would be possible to sustain GDP growth when aiming to reduce resource use or emissions and might hence be classified as 'growth agnostic', i.e. a-growth (van den Bergh and Kallis 2012). A striking number of one third of the analyzed literature was concerned only with the correlation or causality between energy or resource use and economic growth without explicitly addressing the challenge of decoupling or decarbonization. Policy recommendation in this literature, if at all given, follow a standard green growth repertoire. Some studies which found that growth in energy use Granger-causes GDP growth even argued that saving energy should be viewed cautiously as a policy goal, as it could threaten GDP growth (Yu 2012, Belloumi and Alshehry 2015).
Figure 1 summarizes the strategies and policy recommendations given in the articles according to their frequency. Most interestingly, although many articles conclude that absolute decoupling is empirically rarely found, the recommendations to a large extent stick to a green growth repertoire of increasing efficiency, promoting renewable energy and introducing technological solutions and market-based mechanisms (e.g. internalizing or increasing environmental costs through pricing, attract foreign direct investments, financialization or emission trading). Many articles furthermore call for a restructuring of the economy that turns from fossil-energy intensive industrial production towards the service sector. The figure also shows that policy recommendations hardly contain any 'demand-side measures' (not even environmental awareness). Absolute reductions of resource use and emissions (as opposed to relative improvements) are mentioned in <2% of the subsample.
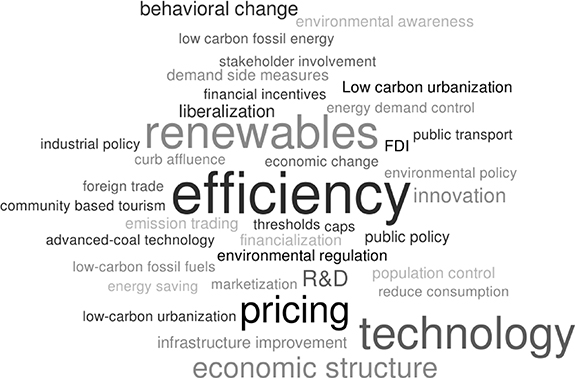
Figure 1. Strategies and policy recommendations visualized according to their frequency (own compilation).
Download figure:
Standard image High-resolution imageThe analysis shows that the large majority of this literature does not question the GDP growth paradigm, even if the empirical evidence suggests that it contradicts officially committed climate policy goals. Policy recommendations point towards a standard repertoire (i.e. efficiency, technology, innovation) that is not further discussed or questioned. Given the focus of the review on studies that quantitatively analyze the relationship between resource use, emissions and economic growth, a less substantive focus on political strategies is not necessarily surprising. However, the separation of quantitative decoupling analyses and more qualitative investigations into the political barriers and potentials towards zero-carbon futures or reduction of energy and materials use may present a problem in itself because it prevents discussion of more effective and realistic strategies based on empirical analyses.
5. Discussion and conclusions
At least since the publication of the seminal 'Limits to growth' report (Meadows et al 1972), a debate is ongoing between scholars who hold that unlimited economic growth is impossible on a finite planet, and other scholars who believe that human ingenuity will eventually overcome all potential limitations to economic growth. The emergence of the notion of 'sustainable development' has suggested that economic development and respect for planetary boundaries (Steffen et al 2015), to use a modern word, can be reconciled. Claims that a decoupling of GDP from resource use and environmental pressures would be possible were already formulated very early on (United Nations 1987).
To contribute to this debate, we deliberately designed this pair of review articles broadly, as we aimed to incorporate a variety of indicators to comprehensively assess the use of biophysical resources (materials and energy) as well as a key class of outflows, namely GHG emissions (Jackson and Victor 2019). GHG emissions are dominated by CO2, i.e. the compound resulting from the combustion of most fuels that humans currently use, and hence a quantitatively dominant outflow of all dissipative use of materials (as opposed to stock-building materials such as concrete or steel; Krausmann et al 2018). This focus on social metabolism in its entirety (Haberl et al 2019) has shown that different patterns can be discerned by focusing on different aspects of resource use, and that the perspectives and results of communities looking at various aspects of resource use differ considerably.
5.1. Synthesis of insights into past decoupling
The large body of literature focused on the causal interrelations between energy and GDP uses econometric time-series and causality testing methods, for example Granger causality, but often shows little interest in the energy indicators analyzed or in actual thermodynamic basis of their hypotheses (see part I, Wiedenhofer et al 2020). While no robust conclusion can be drawn on the direction of causality, these studies show that energy and GDP are strongly related. Stern (2011) has argued that energy is an important factor of production, hence energy scarcity imposes restrictions on economic growth, which supports results from biophysical economics (Kümmel 2011). We found no evidence in the reviewed literature that would question this assertion.
The second group of articles (section 3.2) pays a lot of attention to the meaning of the energy indicators used. Many of the authors in this community come from energy analysis and regard themselves as analysts of 'biophysical economics' (Cleveland 1987, Hall et al 2001, Kümmel 2011). Their conviction is that energy use is a key factor of production (Ayres 2016), and that the quality of energy is hence crucial for assessing the role of energy in the economy (Hall et al 1986, Giampietro 2006, Haberl 2006). The main conclusions are that useful exergy and GDP are tightly coupled and that at the useful stage of energy use there is no evidence for relative decoupling. However, this does not mean that decoupling is not possible between primary energy and GDP, which is important because GHG emissions and extraction of energy resources are linked to primary energy, not useful exergy (Haberl 2006). The conclusion from this literature is that primary energy use can be decoupled from GDP only to the extent to which conversion efficiency from primary energy to useful exergy can be increased.
The review of social metabolism studies based on MEFA methods (Haberl et al 2004, Fischer-Kowalski et al 2011, Krausmann et al 2017a) exemplifies the richness of measures of resource use and their different specific meanings (section 3.3). This community is well aware of the importance of a rich set of indicators, in particular of the difference between production-based and consumption-based accounts. This literature suggests that production-based relative decoupling is frequent, although countries exist in which use of physical resources grows faster than GDP. This seems to happen especially at early stages of the agrarian-industrial transition when large stocks of infrastructures and buildings are accumulated, as well as in export-oriented countries where production of raw materials and early processing stages are dominant. Absolute decoupling is rare and generally only occurs during periods of low GDP growth (Steinberger et al 2013). At the global level, only relative decoupling can be observed (Krausmann et al 2017b). In recent years several global multi-regional input-output models have been established which allow allocating extracted primary resources to final demand of any economy (Inomata and Owen 2014, Wiedmann and Lenzen 2018). Consumption-based analyses suggest that decoupling of production-based material flows is often contrasted by increases of material footprints that are similar to those of GDP (Giljum et al 2014a, Pothen and Schymura 2015, Wiedmann et al 2015).
Current trajectories of material and energy use, whether suggesting decoupling of resource use from economic growth or not, cannot be correctly interpreted without considering past material and energy flows on which they are also based. Current stagnation in per capita territorial/production-based resource use (Fishman et al 2016, Bleischwitz et al 2018a), for example, depends on past material flows (Mayer et al 2017) and entail a substantial legacy for the future (Krausmann et al 2017c). Since some materials enter the socio-economic system to be consumed for their energy content while others are for building up stock (manufactured capital) (Haas et al 2015), it may well be that different strategies are needed to observe, analyse, and set targets for decoupling material use of these two streams. Therefore, more insights can be expected by moving from studies of the decoupling of GDP from one resource or emission indicator to analysing interdependencies between GDP and multiple resources flows, respectively material stocks and resource or emission flows (Haberl et al 2017, Krausmann et al 2017c).
In recent years, a hypothesized S-shaped curve of material growth suggesting a notion of 'saturation', i.e. a stable level of materials use, has gained prominence. In the MEFA community, the idea of saturation has recently attracted more attention than the EKC. This would imply sustenance of a stable, perhaps high, level of materials use coinciding with a continued growth of GDP and perhaps other socioeconomic indicators, in accordance with the 'steady state economy' discourse (Daly 1973, O'Neill 2015). However, so far, no consensus could be achieved on many important conceptual questions. It remains unclear whether saturation should be defined as country totals or per capita, whether consumption- or production-based flows (or material stocks) should be stabilized, and whether saturation should be achieved at the same level for all countries (Müller et al 2011, Pauliuk et al 2013, Chen and Graedel 2015, Fishman et al 2016, Cao et al 2017, Bleischwitz et al 2018a). Moreover, stabilization at a high level may fall short of achieving many sustainability and climate targets.
The literature on CO2 and other GHG emissions is large and growing fast (Wiedenhofer et al 2020). Most of the studies on territorial CO2 use econometric methods, and many are based on the EKC framework (section 3.1). Empirical support for the existence of an EKC-type inverted U-shape of the relation between CO2 emissions and GDP is seldom found (Sarkodie and Strezov 2019). This also holds for total GHG emissions (section 3.4). Even when the data seem to suggest such a curve, the downward-bent part of the curve is usually too far in the future to be of use in reaching ambitious climate targets such as the Paris accord. The GHG emission literature reviewed in section 3.4 suggests a similar pattern as for material use: relative decoupling is the norm rather the exception, but cases of absolute decoupling are rare. A recent study, however, has identified and analyzed 18 'peak-and-decline' countries in which CO2 emissions are falling in both territorial and consumption-based system boundaries (Le Quéré et al 2019). The study concludes that emissions in these 18 countries fell by a median −2.4%/year (25–75 percentile: −1.4% to −2.9%/year) over the period 2005–2015. Almost half of that reduction has been due to a decline in the share of fossil fuels in final energy use. A bit over one-third resulted from reductions of energy use. The study provides evidence that these reductions were a result of targeted policies to promote renewables and raise energy efficiency, but also profited from relatively low GDP growth rates between 1%–2%/year, which is similar to decoupling rates observed in MEFA studies (Steinberger et al 2013). It also noted that rates of CO2 reduction achieved so far fell short from those required to comply with stringent CO2 reduction targets as those implied by the Paris climate accord.
5.2. Current state of decoupling in the last decade
Because the analysis of the literature has yielded only limited aggregate insight into elasticities between GDP and resource/emission indicators due to the variety of measures used in the literature to describe (de)coupling, we summarize some information on the last decade in figure 2. Elasticities were calculated as OLS log regressions over 10 years using the formula log(resource/emission) = α + β log(GDP) +  . A median elasticity of CO2 of 0.4 in the higher income class (top panels in figure 2) means that for 1% of GDP growth, production-based CO2 emissions grew by 0.4%. Elasticities below zero indicate absolute decoupling and elasticities >1 that resources/emissions grew faster than GDP. Results should be interpreted with caution in particular for those parts of figure 2 where data were only available for few countries (see sample sizes in blue font color). Median values of elasticities are close to one for most of the indicators in the low-income class, while they are often substantially lower than one for the higher income class. For the higher income class, elasticities of consumption-based (CB) indicators are highest for material use and substantially lower for CO2 and GHG. For the lower income class, the highest median values are found for production-based emissions. Negative elasticities, indicating absolute decoupling, are most frequent for production-based GHG emission accounts and consumption-based TPES and CO2 accounts for high income countries. For other indicators, instances of absolute decoupling also exist in the group of high-income countries, but are very rare for lower income countries. Thus, the results from our regression analysis over a 10-year timeframe are largely consistent with the main findings from our literature review.
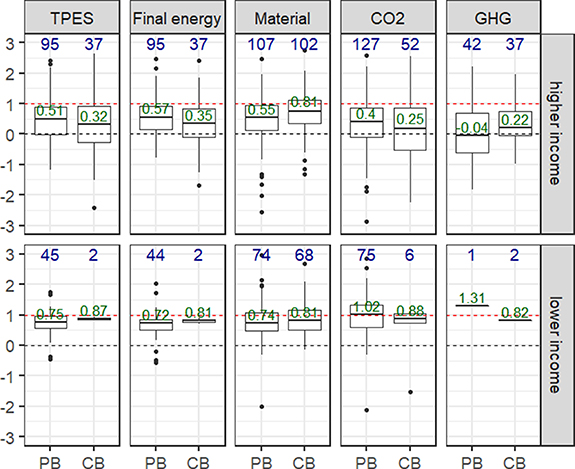
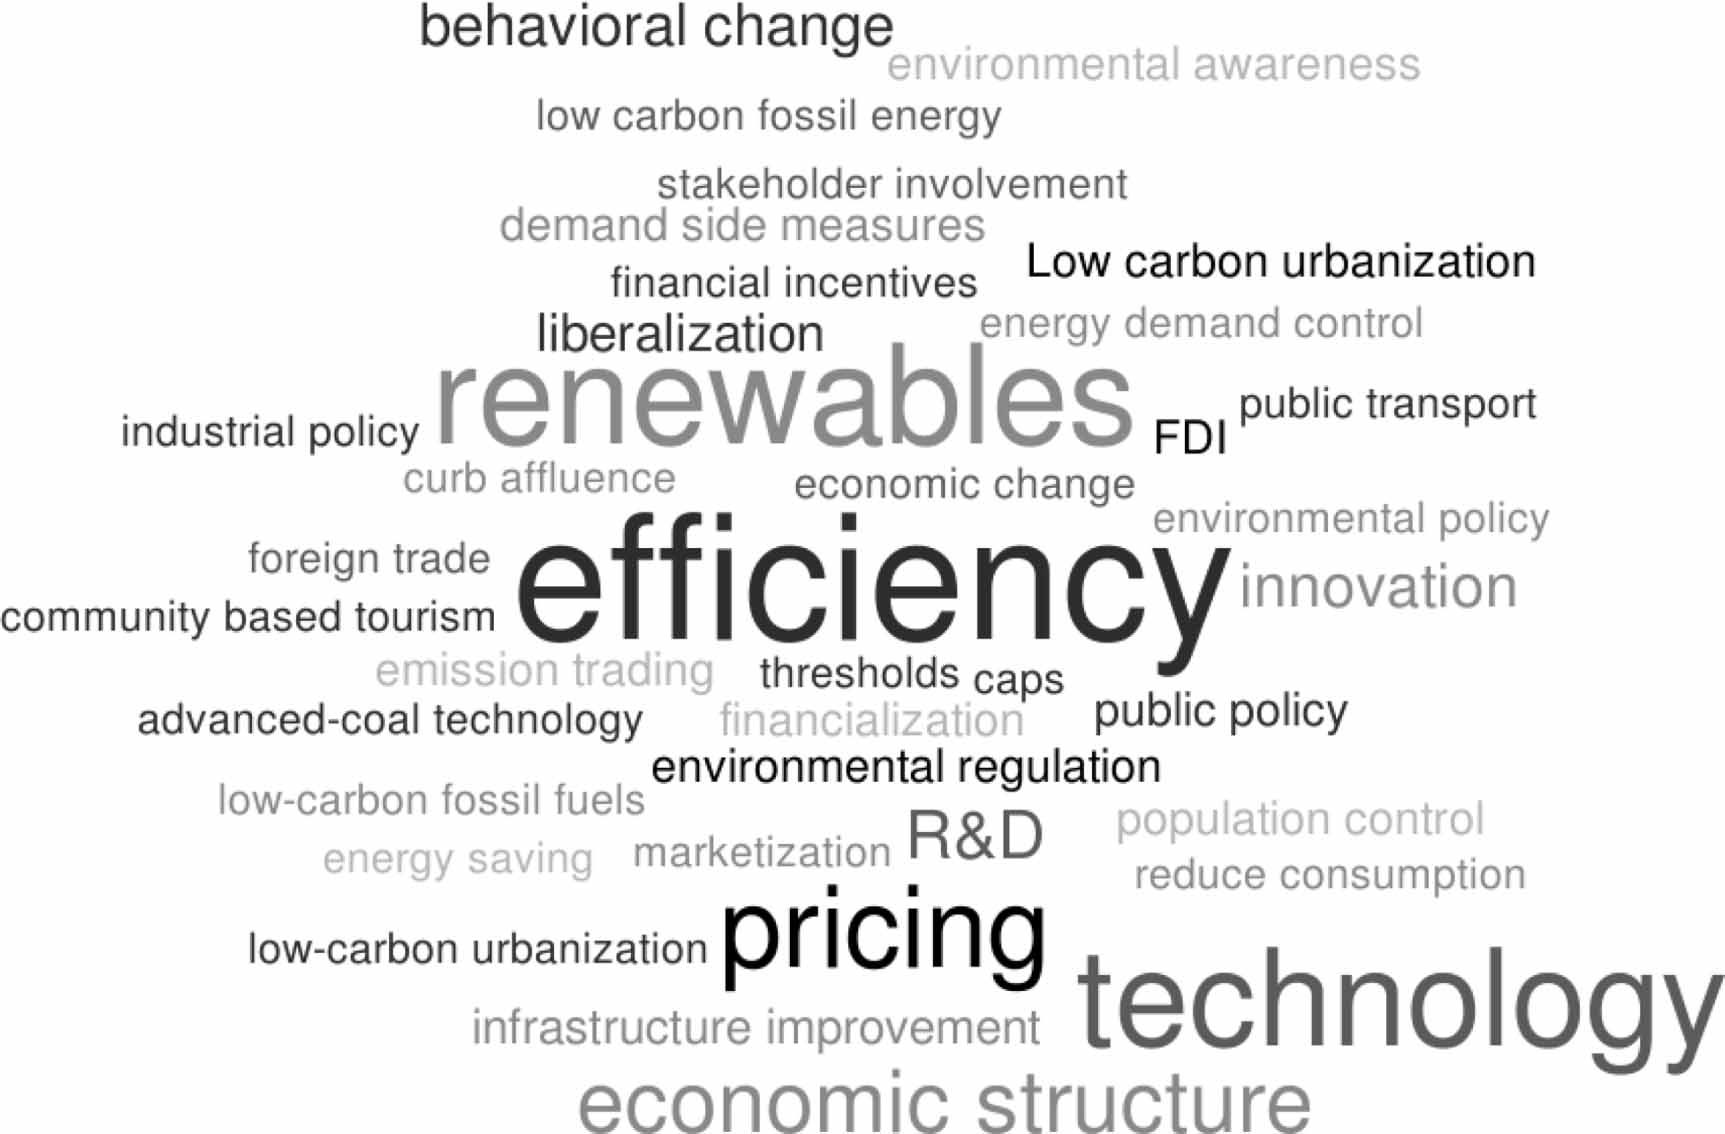
Figure 2. Resource and emission elasticities of GDP in two classes of higher income and lower income countries in the last 10 years. Box plots show medians, quartiles and ranges of elasticities (% change in resource use or emissions per % change in real GDP). Sample sizes are given at the top of the graphs in blue and median values in green font color. Production-based (PB) and consumption-based (CB) figures are shown separately. 'Lower income' refers to the 'low' and 'lower middle' income categories of the World Bank (2019b) classification; 'higher income' is the sum of 'upper middle' and 'high' incomes. Data were extracted on November 19, 2019 from the following sources: Domestic material consumption (Material PB) & material footprint (Material CB) from (UNE IRP 2019) material flow database for 2004–2013. Total primary energy supply (TPES PB) & total final energy consumption (TFC PB) from (IEA 2019) energy balances for 2008–2017. Territorial CO2 emissions from fossil fuels and industrial processes (CO2 PB) from the global carbon budget 2018 (Le Quéré et al 2018) for 2008–2017. CO2 footprint from fossil fuel combustion (CO2 CB) from Wood et al (2019b) for 2007–2016. Total territorial greenhouse gases with LULUCF in CO2eq (GHG PB) from (UNFCCC 2019) for 2008–2017; Total GHG footprint except LULUCF (GHG CB) & TPES footprint (TPES CB) & TFC footprint (TFC CB) from EXIOBASE 3 (Wood et al 2018) for 2003–2012; GDP (constant 2010 US$) from UN national accounts (UN 2019). See suplementary data, available at https://stacks.iop.org/ERL/15/065003/mmedia.
Download figure:
Standard image High-resolution image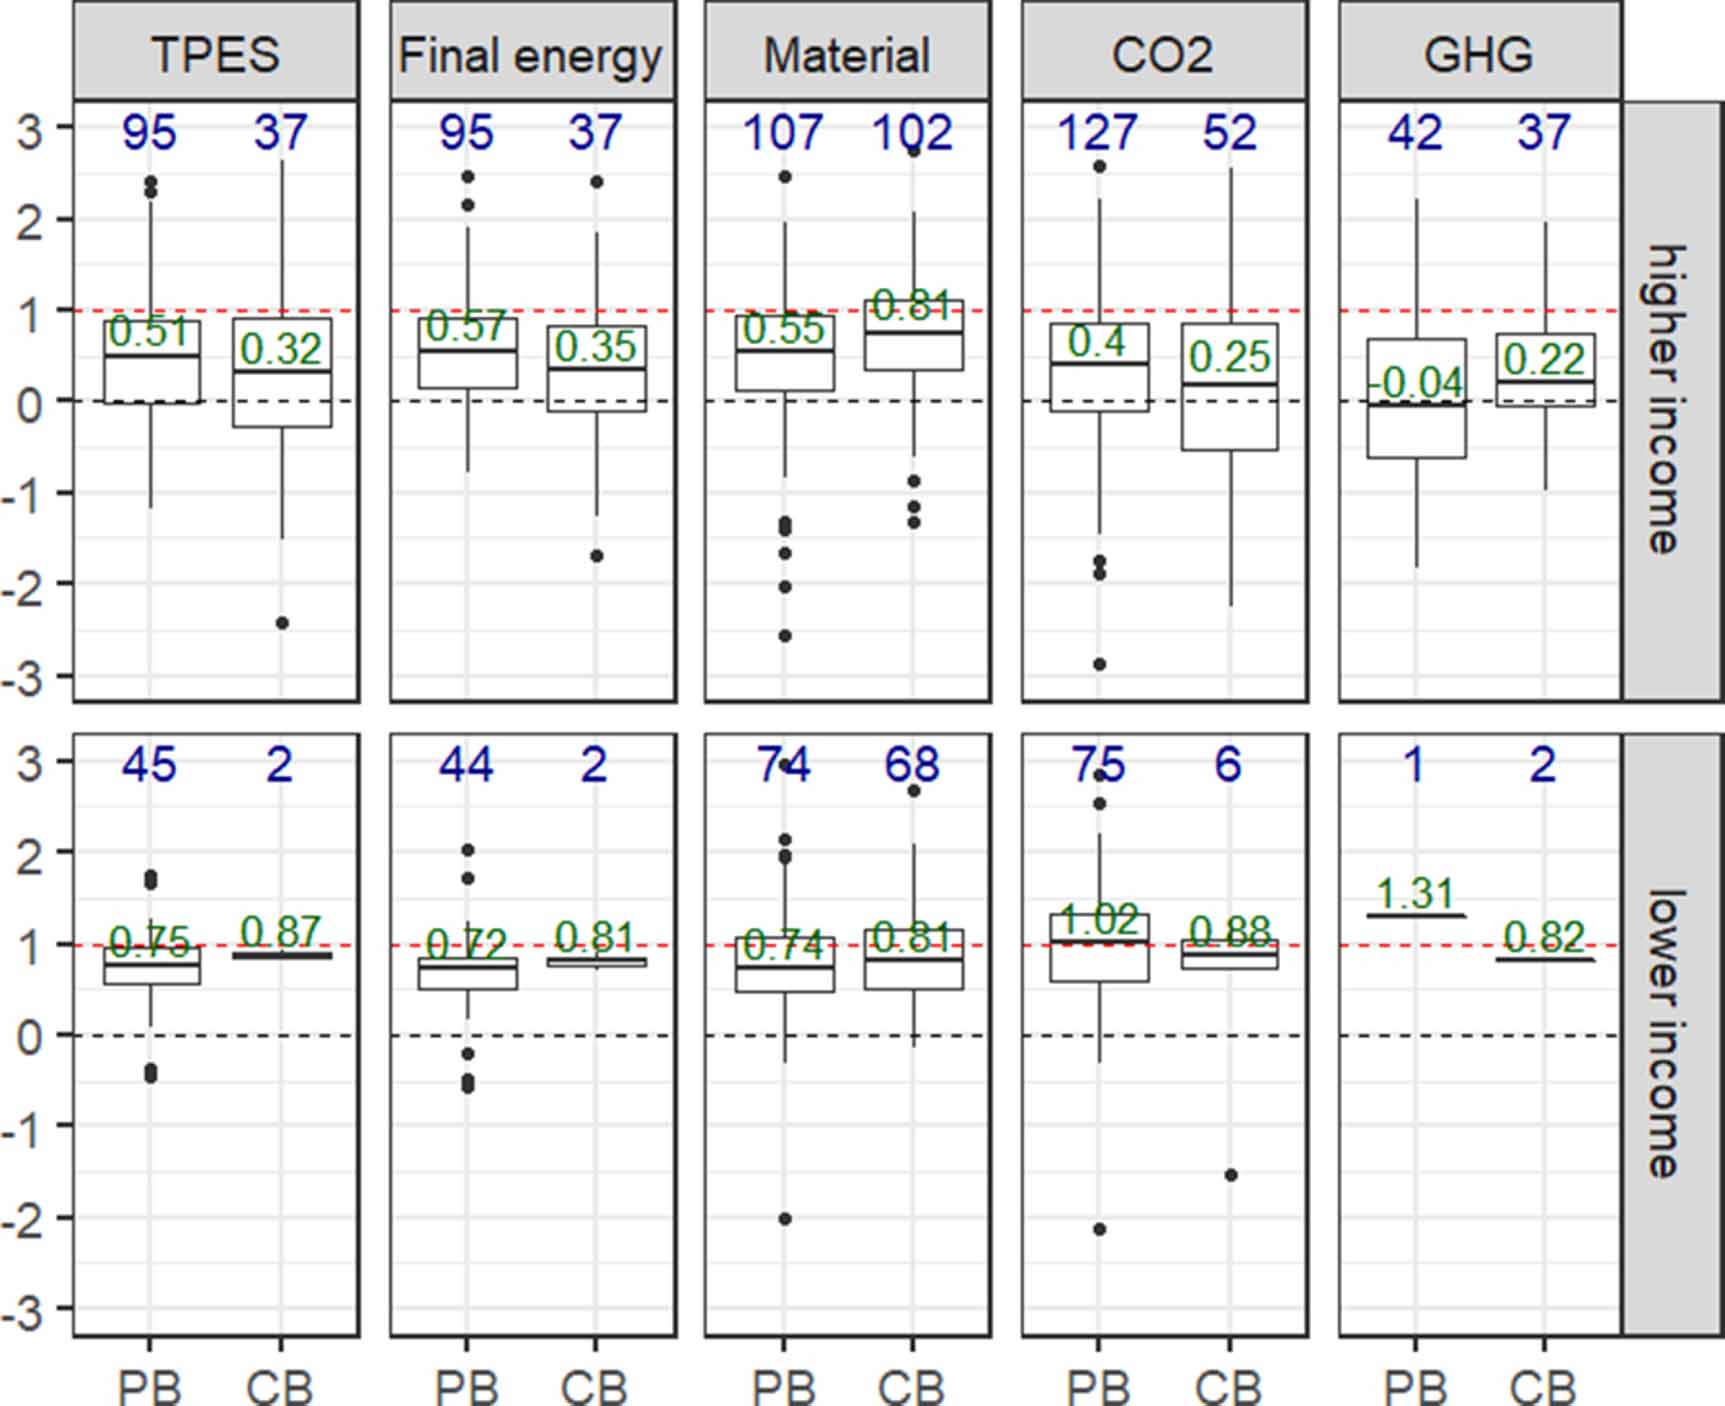
5.3. Implications for future decoupling research and policies
What, then, are the conclusions for the prospects to achieve absolute decoupling in the future? The analyzed literature provides ample evidence that a continuation of past trends will not yield absolute reductions of resource use or GHG emissions. So far, environment and climate policies have at best achieved relative decoupling between GDP and resource use respectively GHG emissions (Kemp-Benedict 2018, Haberl et al 2019). Exceptions include a group of 18 countries that have reduced CO2 emissions in the last decade (Le Quéré et al 2019), and a few national cases, most of which are due to specific circumstances that probably should not be generalized (e.g. when falling resource use stems from economic crises; Shao et al 2017). This observed absolute decoupling, however, falls short from the massive decoupling required to achieve agreed climate targets (Jackson and Victor 2016). Of course, rare occurrence of absolute decoupling in the past does not represent proof that it cannot become more common in the future—and perhaps intensifying the policies implemented in 18 peak-and-decline countries could yield sufficient decoupling of GDP and GHG emissions to achieve climate targets. Even if rapid deployment of renewable energy could be achieved, however, the world's addiction to material resources would likely not wane, as harnessing renewables also requires substantial investments into large-scale buildings (e.g. hydropower plants), machinery (e.g. wind turbines, photovoltaic power plants) and infrastructures (e.g. expansion and reinforcement of electric transmission grids; Beylot et al 2019, Watari et al 2019).
In any case, meeting the goals of the Paris Agreement will require new and more effective policies than those deployed so far. These need to be based on absolute—not relative—reduction goals for GHG emissions, which could strongly benefit from curbing growth of resource use (Krausmann et al 2020). The IPCC 1.5 °C report (IPCC 2018) shows that even if high hopes are placed in future deployment of negative emission technologies, fast and deep cuts in global GHG emissions are required in order to address the 2.0 °C target agreed upon in the Paris climate accord, and even more so for reaching 1.5 °C. Currently, targets for reducing resource use or emissions are commonly framed as improvements of e.g. energy/GDP ratios. For example, SDG 7.3 aims at doubling the rate of energy intensity (energy/GDP) reduction, from approx. −1.5%/year to −3.0%/year. However, such targets allow substantial increases of resource use in absolute numbers if GDP growth is sufficiently fast (Heun and Brockway 2019). Hence, absolute GHG reduction goals can only be achieved if absolute goals for emission reductions are agreed upon. The analysis of policies and strategies (section 4) shows that decoupling research is so far poorly equipped to deal with this challenge. Only a tiny fraction of the decoupling literature in our random sample adopted a 'degrowth' perspective, which we have defined very broadly as a worldview allowing to question the priority of GDP growth over environmental goals. Whether one follows the viewpoint that a decoupling of GDP from environmental impacts is impossible (Ward et al 2016, Hickel and Kallis 2019) may be less important than accepting the need to achieve absolute reductions of emissions regardless of GDP trajectories. Similar considerations apply to the use of many other biophysical resources (Green and Denniss 2018, Lazarus and van Asselt 2018).
A recent review suggest that strategies towards efficiency have to be complemented by those pushing sufficiency (Parrique et al 2019), that is, 'the direct downscaling of economic production in many sectors and parallel reduction of consumption' (p 3). Although concrete political strategies towards sufficiency—or degrowth—are still fragmented and diverse, they may include restrictive supply-side policy instruments targeting fossil fuels (instead of relative efficiency improvements), redistribution (of work and leisure, natural resources and wealth), a decentralization of the economy or new social security institutions (that complement the growth-oriented welfare state). Recently suggested policies include moratoria on resource extraction and new infrastructures (e.g. coal power plants, highways, airports), bans on harmful activities (e.g. fracking, coal mining), the reduction of working hours and redistributive taxation, instead of just putting a price on resources and emissions (Schneider et al 2010, Kallis 2011, Koch 2013, Sekulova et al 2013, Jackson 2016, Green and Denniss 2018, Hickel and Kallis 2019). A new study suggests, however, that even energy sufficiency actions may be associated with rebound effects and negative spillovers (Sorrell et al 2020).
In any case, recent research suggests that states have so far refrained from strategies of sufficiency as these may contradict their claimed structural dependence on economic growth for the generation of tax revenue, employment and consumption-based political legitimacy. A strategic turn towards sufficiency that involves reductions in overall consumption levels and may lead to a degrowing economy might therefore pose a fundamental challenge to contemporary states—and liberal democracies (Pichler et al 2018, Hausknost 2019, Koch 2019). Studies in sustainable consumption increasingly argue that a decisive turn towards 'strong sustainable consumption governance' (Lorek and Fuchs 2013), that is, a clear focus on reducing the volume of the materials and energy resources consumed while maintaining levels of well-being, will be a key required for deep decarbonization.
Another recent strand of literature is focused on overcoming GDP as key target indicator of economic policy (Hoekstra 2019). This debate suggests that GDP may be becoming an increasingly irrelevant measure of welfare, as it was only loosely coupled with wellbeing in OECD countries over the last 40 years (Hoekstra 2019). In this view, GDP should be replaced or at least complemented by measures of wellbeing and planetary health, as suggested in the dashboard approach of the Sen-Stiglitz-Fitoussi-report (Stiglitz et al 2009), and in the Sustainable Development Goals. Scholars increasingly focus more on improving social wellbeing rather than GDP growth. One conceptual angle is the 'stock-flow-service' nexus approach (Haberl et al 2017, 2019) suggesting that designing currently resource-intensive systems to provide for key contributions to social wellbeing (e.g. access/transport, housing/shelter, provision of food) in a resource-sparing manner in the first place can deliver these services at much lower levels of resource inputs than now. An example would be spatial patterns of settlements and work places that minimize the need for commuting, and foster commuting by environmentally friendly means such as walking, cycling or use of public transit. Such a focus on demand-side measures consistent with provision of services that are vital for social well-being is at the core of a currently emerging research community (Cullen et al 2011, Creutzig et al 2016, 2018, Brand-Correa and Steinberger 2017, Carmona et al 2017, Lamb and Steinberger 2017, Vita et al 2019). Perhaps the question to what extent GDP can be decoupled from resource use or emissions will turn out to be less important than the question how a good life for all on the planet can be organized within the planet's environmental limits (O'Neill et al 2018). Reductions in resource use and emissions commensurate with climate and sustainability goals (IPCC 2018, TWI2050 2018) may still be achieved by turning towards sufficiency and other transformative strategies.
Acknowledgments
This research has received funding from the European Research Council (ERC) under the European Union's Horizon 2020 research and innovation programme (MAT_STOCKS, Grant No. 741950) and the Austrian Science Funds (FWF, Grant MISO P27590). Paul Brockway was funded by the UK Research Council under EPSRC Fellowship award EP/R024254/1. Anke Schaffartzik acknowledges financial support from the Spanish Ministry of Economy and Competitiveness, through the 'María de Maeztu' program for Units of Excellence (MDM-2015-0552). We gratefully acknowledge help in managing references by research assistants Andrea Gutson, Lisa Laßnig, Vivianne Rau, Anna Untersteiner, by Nicolas Roux for calculation of elasticities in figure 2, and the constructive comments of two anonymous reviewers.
Data availability statement
Any data that support the findings of this study are included within the article.
Footnotes
- 10
Spurious correlation is where variables trending over time appear to be correlated with each other simply because of the shared directionality, but there is no true underlying relationship (Stern 2011).
- 11
The 'tendency of authors and journals to preferentially publish statistically significant or theory-conforming results' (Bruns et al 2013).
- 12
These studies were not found by the search query as they lacked keywords filtered by the query. We cross-checked elasticities between GHG footprints and GDP as reported in these studies (where available), which confirmed the results of the literature analyzed in Table 3.