

Abstract
Climate-smart agriculture (CSA) is fronted as a sustainable, transformative, and technologically innovative approach that increases agricultural productivity, income and enhances greenhouse gas mitigation. However, there is limited micro-level evidence on the effects of the adoption of CSA on food security despite intensified promotion efforts in Uganda. A cross-sectional household survey among 165 respondents, undertaken in August–September 2020, was used to collect requisite data. Principal component analysis (PCA) with iteration and varimax rotation and analysis of variance were used in characterizing CSA practices. An ordered logit model was applied to identify the reported levels of CSA utility. Meanwhile, an endogenous switching regression was adopted to determine the effect of CSA adoption on household food security. Results showed that households used a combination of practices, including soil and water management, pasture management, livestock productivity and disease management. The PCA results revealed six major categories for the 16 most commonly used CSA practice combinations. The key factors that influenced the adoption of CSA practices among households included; access to climate information, total livestock units, ownership of non-livestock assets, and participation in off-farm activities. Results also revealed that the expected food consumption scores (FCS) for adopters and non-adopters were 53.87 and 66.92 respectively. However, when adopters and non-adopters were compared, we found that the adopters of CSA practices would have had a significantly lower counterfactual FCS had they not adopted CSA. While the adoption levels of CSA in this study is low, the counterfactual effects have shown that households that adopted CSA would have had a lower FCS and therefore lower food security status had they not adopted CSA. We recommend CSA promotional efforts that give more attention to combined CSA practices and respond to local production constraints.
Export citation and abstract BibTeX RIS

Original content from this work may be used under the terms of the Creative Commons Attribution 4.0 license. Any further distribution of this work must maintain attribution to the author(s) and the title of the work, journal citation and DOI.
1. Introduction
Current climate variability and change patterns are having severe impacts on human livelihoods [1] and are further compounding socio-economic and biophysical constraints to development [2]. Predictions have shown that these observed patterns will be increasing in intensity and unpredictability over sub-Saharan Africa [3]. These projected patterns of climate change, particularly increased temperatures and shifting precipitation patterns [4], will have significant adverse effects on agriculture, especially on staple crops and food security [3, 5]. This has raised questions as to whether sub-Saharan Africa will have reliable food sources necessary for healthy human life. This is critical because the sub-region already has one of the largest gaps between cereal consumption and production with a high food import bill estimated at over US$70 billion annually and further projected to rise to US$110 billion by 2025 [6].
However, addressing the negative impacts of climate variability and change on agriculture requires adaptation and mitigation efforts in line with the Malabo Declaration commitments to enhance the resilience of livelihoods and production systems affected by climate variability, change, and associated risks [7]. These efforts will also contribute to achieving the Sustainable Development Goals on climate action and Zero Hunger. In the last 13 years, the concept of climate-smart agriculture (CSA) since its development in 2009 has made significant gains as a global approach, providing applicable principles for managing agriculture for food security under climate change [8]. Developed in response to the need to recognize agriculture's role in food security and its potential for capturing synergies between adaptation and mitigation, CSA seeks to improve food security, reduce climate-related risks, and mitigate climate change [2].
Considerable investments, estimates of up to US$500 million, have been injected to promote the adoption of CSA in sub-Saharan Africa and have been intensifying [9]. Several countries in Africa have considered CSA as an effective approach to addressing agricultural productivity challenges, supporting adaptation strategies, and building resilience to climate change [10]. Accordingly, with the realization of the net gains CSA in practice provides, investment and financing have been undertaken in various agricultural sectors [11]. However, despite the investments and attention towards CSA, there remains a dearth of information on the potential effects of adoption [4]. Within the developing countries, especially those in sub-Saharan Africa, there have been several approaches promoted as a mechanism to increase food production and minimize climate change impacts [12]. These have created a state of 'conflict' across various stakeholders; for example, trade-off contestation, such as whether to increase food production to meet human demands or to instead curtail agricultural practices to reduce greenhouse gas emissions [13].
Despite these contestations, CSA has received considerable international acclaim due to its capacity to sustainably increase food productivity and ecosystem resilience while reducing greenhouse gas emissions [14, 15]. Owing to the fact that agriculture is both the primary source of livelihood and contributor of greenhouse gas emissions, CSA presents itself as a key intervention [16]. This is particularly important because it continues to reorient agricultural systems to support food security under the realities of climate change [17]. In Kenya for example, CSA benefits have been realized [18, 19]; and similar realizations have occurred in five other east and southern African countries: Tanzania, Malawi, Mozambique, Zimbabwe, and Zambia [9]. Similarly, in parts of Uganda, such as Nakasongola [20] and Karamoja [21] where climate variability and change stresses are a common phenomenon, there has been significant promotion of CSA. Several researchers [21–24] have shown interventions of the approach in Uganda; and further interventions by USAID's Feed the Future [25, 26] have been implemented. Additionally, these interventions have shown that CSA produces positive returns on investment [27].
Although CSA practices are being promoted across the country, with the aim to build resilience of smallholder farmers, there are still few studies [28, 29] that have provided evidence of the effects of the adoption of such practices on household food security [20, 29, 30] at the micro-scale level. Districts, including Nakasongola, that have received several interventions on CSA owing to high climate variability and change [22, 26, 31], have limited evidence both for and against the contribution of the approach on their food security status. This study thus pursued a micro-level analysis of CSA adoption effects on household food security in the Nakasongola District in Central Uganda. It specifically, identified the CSA practices in used and determined the factors influencing their adoption. We also determined the effect of CSA practices on household food security, and estimated the conditional effect of CSA practices' adoption on household food security in Nakasongola District, Uganda.
2. Materials and methods
2.1. Description of the study area
This study was conducted in the Nakasongola District, located in the central region of Uganda. Nakasongola District has 11 sub-counties namely: Kalungi, Kakooge, Kakooge Town Council, Lwampanga, Nabisweera, Wabinyonyi, Nakitoma, Migeera Town Council, Lwabiyata, Kalongo, with the Nakasongola Town Council forming its administrative units (figure 1). The main livelihood activities in Nakasongola District include crop farming, pastoralism, and fishing around Lake Kyoga [32]. The district experiences bimodal rainfall—the first rain season occurring from March to May, and the second between August and November [32, 33]. It is also one of the arid and semi-arid areas of Uganda, often characterized by rampant drought incidences, and a reason for the intensive promotion of CSA practices to boost food security. The main vegetation types are woodland, woodland savanna, thicket, and softwood plantations of exotic trees, including Eucalyptus sp and Pinus sp. Within these vegetation covers are cultivated patches [34].
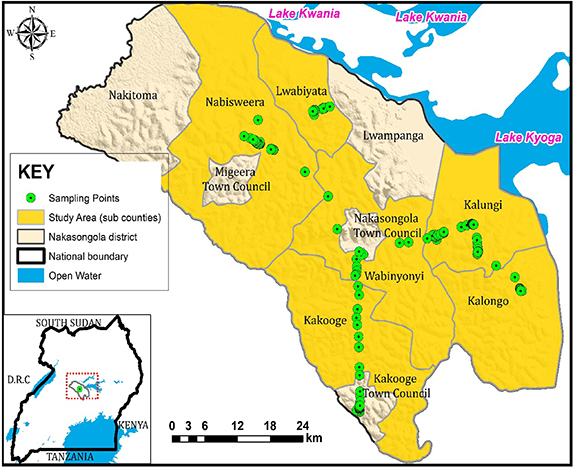
Figure 1. Location and map of the Nakasongola District. (Source: generated during this study.)
Download figure:
Standard image High-resolution image2.2. Data collection
A cross-sectional survey approach was utilized in undertaking data collection, making use of guided interviews with 170 randomly selected farm households between August–September 2020. However, only 165 respondents interviews were considered out of the sample size of 170, this because five respondents had considerably incomplete data. The sample size was drawn out of the household population of 36 610 [35] with a 7.5% acceptable margin of error and a population proportion of 50% [36] considering that the project report had aggregated the overall number of beneficiaries (22 000) across the six districts cattle corridor of Uganda where the interventions had been implemented [37]. Accordingly, the logical consideration was to use the number of households in the district to guide the determination of the sample size. Data was collected by trained research assistants using pre-tested, semi-structured questionnaires. Target sub-counties and villages were based on the intensity of activities geared towards the promotion of CSA that had been implemented by the district and other development partners [37, 38] but the sample proportionately allocated across the parishes. The guidance was provided by the District Production Officer (Key Informant) who has been coordinating all CSA interventions in the district. Once the target sub-counties were identified and selected, random sampling was undertaken across the district's eight sub-counties.
2.3. Analytical framework
CSA practices used in Nakasongola District were identified and grouped into heterogeneous principal clusters via the use of principal component analysis (PCA). Homogenous practices were grouped into four composite clusters. With minimal additional effort, PCA provides a roadmap for how to reduce a complex data set to a lower dimension in order to reveal the sometimes hidden, simplified dynamics that often underlie it. Observed and unobserved factors influencing choice of a particular practice were combined to develop clusters. The practices were grouped using PCA and the iteration and varimax rotation in the model represented as shown below:


where  to
to  are uncorrelated principal components,
  to
to  are correlation coefficients, and
  to
to  are factors influencing choice of a particular strategy. CSA practices identified and grouped into CSA strategies through a PCA are presented in table 2.
2.4. Determining factors influencing the adoption of CSA practices used in Nakasongola District, Uganda
This study employed an ordered response model to determine the factors influencing the number of CSA strategies adopted. Ordered probit models are one of the discrete choice models that draws its foundation from the ordinal utility theory and random utility theory [39]. According to the ordinal theory, observations from CSA technology adoption could only reveal preference rankings and showed that individuals prefer more alternatives with greater utility to fewer alternatives with less [40]. This implies that the number of CSA strategies chosen cannot be scaled in numbers but instead arranged in order of preference and utility ranked on the basis of adoption. Therefore, a rational individual is expected to choose J number of alternatives if the utility derived is greater than for the K number of alternatives, such that utility from J is greater than utility from K given that J is not equal to K as specified in equation (1) below:

The dependent variable in the model is the number of CSA technology strategies chosen, which is conceptualized by how higher a household's number of CSA strategies adopted was. Adoption of CSA strategies is hypothesized to be affected by both individual and household-specific socio-economic and demographic factors (age, education, and family size, livestock ownership, among others); farm attributes, such as farm size; and community/institutional factors, such as access to extension and distance to key amenities relative to household location. The dependent variable was categorized into three major categories as specified in equation (4), with Yi being the level of utility:

where  is the unobserved latent utility from adoption of a given set of CSAs,
  is the observed adoption of CSA strategies. Observed adoption was modeled using the ordinal response model as shown in equation (5):

where,  is the observed adoption of CSA strategies and is the observed level of adoption of CSAs by the respondent, X is a vector of explanatory variables, α is the intercept utility, β are the coefficients to be estimated, and µ the random disturbance. The random disturbance was assumed to follow a logistic distribution, hence the choice of an ordered logit model to determine the factors affecting adoption of CSA strategies.
2.5. Determining the effect of CSA practices on household food security in Nakasongola District, Uganda
Endogenous switching regression models were adopted to determine the effect of CSA adoption on household food security. The endogenous switching regression model employs a two-step estimation procedure to estimate treatment effects [41]. The approach comprises the selection equation and two continuous regressions that describe the behavior of a farmer as they face the two regimes of adopting or not adopting any CSA strategy. Average treatment effects were estimated using household survey data to determine the effect of adoption of CSAs on household food security. In this study, the first step involved estimation of the adoption equation to compute the selection correction term (inverse Mills ratio) and understand the drivers of adoption (equation (4)) of CSA strategies. The inverse Mills ratio was then used as an additional regressor in the second stage to estimate the direct effects of adoption of CSA strategies on household food security in Nakasongola District. The selection equation was defined as:

where  is an unobservable variable for CSA technologies adoption and, Ai
is its observable counterpart—the dependent variable (adoption of CSA technologies) which equals 1, if one adopts CSAs and zero otherwise. X is a vector of exogenous variables (such as age, main occupation, education, household size, distance to key resource areas, income, tropical livestock units, among others), β is a vector of unknown parameters, and µ is the random disturbance term. Equation (6) was estimated as a probit model due to the binary nature of the dependent variable.
is an unobservable variable for CSA technologies adoption and, Ai
is its observable counterpart—the dependent variable (adoption of CSA technologies) which equals 1, if one adopts CSAs and zero otherwise. X is a vector of exogenous variables (such as age, main occupation, education, household size, distance to key resource areas, income, tropical livestock units, among others), β is a vector of unknown parameters, and µ is the random disturbance term. Equation (6) was estimated as a probit model due to the binary nature of the dependent variable.
In the second step, two welfare regression equations (household food security) where farmers face two regimes of adopting or not adopting CSA strategies were estimated as defined in equation system (7):


where  is household food security in the continuous equations,
  denotes a vector of exogenous variables (age, household size, marital status, on-farm and off-farm income, education, access to credit, and tropical livestock units, among others),
  are vectors of parameters,
  is the estimated inverse mills ratio derived from the first stage (equation (6)), and
  are random disturbance terms. The food consumption scores (FCS) methodology adopted from the United Nations World Food Program [42] was used to measure food security. The FCS is a composite continuous score ranging from 0 to 112 based on dietary diversity, food frequency, and relative nutritional importance of different food groups [43]. The higher the score, the more food secure a household is.
2.6. Estimating the conditional effect of CSA practices' adoption on household food security
The food security function specified in equations (7a ) and (7b ) was used to derive the expected actual and counterfactual outcomes that were then used to estimate the adoption effects. The counterfactual is the expected FCS of adopters if the returns on their observed and unobserved resources/covariates had the same returns as the current returns to non-adopters' observed and unobserved characteristics. The actual expected outcome is observed in the data. These were expressed as adopted from [44]:


Cases (8a
) and (8b
) represent the actual expectations observed in the sample while cases (8c
) and (8d
) represent the counterfactual expected outcomes. The average adoption effect on food security of adopters ( ) is derived as the difference between equations (8a
) and (8c
) as specified in equation (8e
). The difference between equations (8d
) and (8b
) provides the average adoption effect on food security of non-adopters (
) is derived as the difference between equations (8a
) and (8c
) as specified in equation (8e
). The difference between equations (8d
) and (8b
) provides the average adoption effect on food security of non-adopters ( ) illustrated as equation (8f
):
) illustrated as equation (8f
):


The second step in the switching regression model is to estimate the resilience model for adopting and non-adopting households. The independent sample T-test was used to compare the variation in mean values of the FCS among the smallholder farmer households that have adopted CSA practices and those that have not.
3. Results
3.1. Socio-demographic characteristics of respondents
Table 1 presents the socio-economic and demographic results variables used to describe the sample and as covariates in the econometric models. The results show that the average FCS was above 42 for both adopting and non-adopting households, which is the acceptable cut-off. However, non-adopting households had a significantly higher FCS than their adopting counterparts. The more CSA-adopting households were members of social groups, had access to credit, and were nearer to their farms compared to the non-adopting households. On the other hand, significantly more non-adopting households were pastoralists and participated in off-farm income-generating activities.
Table 1. Socio-demographic of respondents of adopters and non-adopters used in econometric models.
| Variable | Pooled | Non-adopters | Adopters | t-statistic | |||
|---|---|---|---|---|---|---|---|
| Mean | Std. dev. | Mean | Std. dev. | Mean | Std. dev. | ||
| FCS | 51.518 | 26.316 | 60.761 | 22.899 | 40.955 | 26.118 | 5.1907 |
| Household is in pastoral category (Dummy-1 = yes, 0 otherwise) | 0.697 | 0.461 | 0.761 | 0.429 | 0.623 | 0.488 | 1.9343 |
| Age of the household head in years | 39.0 | 4.169 | 37.398 | 10.988 | 40.623 | 17.012 | −1.4639 |
| Household head is Male (Dummy-1 = yes, 0 otherwise) | 0.539 | 0.500 | 0.557 | 0.500 | 1.519 | 0.503 | 0.4775 |
| Household head is married (Dummy-1 = yes, 0 otherwise) | 0.733 | 0.444 | 0.807 | 0.397 | 0.649 | 0.480 | 2.3047 |
| Number of years of education completed by the household head | 10.800 | 10.281 | 9.648 | 3.670 | 12.117 | 14.470 | −1.5456 |
| Number of people living in the household | 6.364 | 3.080 | 6.420 | 2.377 | 6.299 | 3.742 | 0.2526 |
| Household head can read (Dummy-1 = yes, 0 otherwise) | 0.855 | 0.354 | 0.943 | 0.233 | 0.753 | 0.434 | 3.5625 |
| Household head can write (Dummy-1 = yes, 0 otherwise) | 0.933 | 0.250 | 0.955 | 0.209 | 0.909 | 0.289 | 1.1655 |
| Household member(s) belongs to a social group within the village (Dummy-1 = yes, 0 otherwise) | 0.224 | 0.418 | 0.159 | 0.368 | 0.299 | 0.461 | −2.1624 |
| Household member(s) participates in off-farm income generating activities (Dummy-1 = yes, 0 otherwise) | 0.697 | 0.461 | 0.830 | 0.378 | 0.545 | 0.501 | 4.1391 |
| Total off-farm income in Uganda shillings '000 | 447.000 | 379.000 | 414.000 | 334.000 | 501.000 | 444.000 | −1.1891 |
| Household has access to credit (Dummy-1 = yes, 0 otherwise) | 0.176 | 0.382 | 0.091 | 0.289 | 0.273 | 0.448 | −3.1329 |
| Distance to the nearest market (in Kilo meters) | 57.073 | 41.117 | 43.568 | 18.265 | 72.506 | 53.045 | −4.8042 |
| Distance from the home to the farm (in Kilo meters) | 21.291 | 19.570 | 13.352 | 16.075 | 30.364 | 19.347 | −6.1674 |
| Receives climate related information (Dummy-1 = yes, 0 otherwise) | 0.733 | 0.444 | 0.886 | 0.319 | 0.558 | 0.500 | 5.0838 |
| Has ever heard of CSAs (Dummy-1 = yes, 0 otherwise) | 0.861 | 0.347 | 0.920 | 0.272 | 0.792 | 0.408 | 2.3997 |
| Adopted CSAs (Dummy-1 = yes, 0 otherwise) | 0.852 | 0.356 | 0.901 | 0.300 | 0.787 | 0.413 | 1.9112 |
| Household received extension visit in the last 12 months (Dummy-1 = yes, 0 otherwise) | 0.055 | 0.228 | 0.034 | 0.183 | 0.078 | 0.270 | −1.2351 |
Notes: T-tests were carried out for adopting vs non-adopting households.
3.2. CSA practices identified in Nakasongola District, Uganda
From the list of all CSA technologies (table 2), the 20 most adopted technologies were identified to narrow down the list of commonly used CSA technologies adopted by respondents. The 20 most adopted technologies were subjected to PCA analysis to identify how different technologies combine (table 3). The results show a total of six components (those with eigenvectors above one) which were used in the subsequent analysis. The authors then renamed the combinations based on the factor loadings of the constituent CSA technologies to determine CSA strategies (table 4). The results show that farmers combined CSA technologies in a number of ways to identify different strategies for water, soil, crop yields and disease, livestock, and pasture management.
Table 2. Showing the CSA practices adopted in Nakasongola District.
| Variable (CSA practice) | Mean of CSA practice | Std. dev. of CSA practice |
|---|---|---|
| Soil and Water management practice | ||
| Mulching | 0.44 | 0.50 |
| Organic manure application | 0.64 | 0.48 |
| Soil pH control (liming) | 0.16 | 0.37 |
| Zero tillage | 0.18 | 0.39 |
| Allowing land to fallow for natural regeneration to take place | 0.38 | 0.49 |
| Boundary planting of wind breakers and shelter belts | 0.35 | 0.48 |
| Tree management (e.g. pruning) | 0.19 | 0.39 |
| Terraces and trenches | 0.19 | 0.40 |
| Water management practice | ||
| Irrigation | 0.29 | 0.46 |
| Rainwater harvesting technologies | 0.17 | 0.38 |
| Contour | 0.21 | 0.41 |
| Up-down slope cultivation | 0.20 | 0.40 |
| Weed management practice | ||
| Mulching | 0.39 | 0.49 |
| Cover cropping | 0.42 | 0.49 |
| Organic manure application | 0.26 | 0.44 |
| Others | 0.24 | 0.43 |
| Pasture management practice | ||
| Pasture growing | 0.38 | 0.49 |
| Hay management | 0.15 | 0.36 |
| De-stocking | 0.21 | 0.41 |
| Others | 0.13 | 0.34 |
| Livestock production and disease management practice | ||
| Spraying with acaridae | 0.65 | 0.48 |
| Spraying with locally made tree extracts | 0.17 | 0.38 |
| Drenching/dipping | 0.21 | 0.41 |
| Spraying pastures | 0.19 | 0.40 |
| De-stocking | 0.15 | 0.36 |
| Cross-breeding-hybridization | 0.62 | 0.49 |
| Changing livestock breeds altogether to those believed to be better | 0.15 | 0.36 |
| Rearing traditional livestock | 0.18 | 0.39 |
| Rearing different livestock species (goats, sheep, cattle, donkeys) | 0.30 | 0.46 |
| Rearing of poultry (different types if any mention the types) | 0.11 | 0.31 |
| Adoption of dairy farming | 0.25 | 0.43 |
| Use improved livestock feeds (e.g. feed cakes) | 0.17 | 0.38 |
| Assisted reproduction (e.g. artificial insemination) | 0.15 | 0.36 |
| Rotation grazing in pasture lands | 0.40 | 0.49 |
| Use of improved pastures both leguminous and fodders | 0.15 | 0.35 |
| Others specify | 0.04 | 0.20 |
| Crop yield and disease management practice | ||
| Intercropping/poly culture (multiple crops in an area in a given time) | 0.37 | 0.48 |
| Intercropping with leguminous crops | 0.39 | 0.49 |
| Crop rotation | 0.58 | 0.49 |
| Diversity of crops in the farm (e.g. coffee, potatoes, etc) | 0.26 | 0.44 |
| Diversity in the cultivars/seeds used in the farmer (e.g. different maize varieties, different coffee types, different cassava varieties) | 0.28 | 0.45 |
| Crop-livestock integration (growing crops and keeping livestock in the same farm household) | 0.09 | 0.29 |
| Combined organic and inorganic fertilizer use | 0.19 | 0.39 |
| Application of compost to the field | 0.09 | 0.29 |
| Application of manure to the field | 0.41 | 0.49 |
| Combined organic treatments/inputs (a mixture of residues, manure, biochar, compost,) | 0.17 | 0.38 |
| Application of crop residue | 0.15 | 0.36 |
| Drip irrigation | 0.15 | 0.36 |
| Rainwater harvesting for application to crops | 0.16 | 0.37 |
| Planting drought tolerant crops | 0.21 | 0.41 |
| Agroforestry | 0.17 | 0.38 |
| Push and pull/edge planting | 0.13 | 0.33 |
| Improved crop varieties | 0.56 | 0.50 |
| Improved post-harvest handing | 0.16 | 0.37 |
| Specify |
Table 3. Loadings of the six components for the CSA compositions.
| S/N | Variable | Comp1 | Comp2 | Comp3 | Comp4 | Comp5 | Comp6 | Communality |
|---|---|---|---|---|---|---|---|---|
| 1 | Mulching | 0.2125 | 0.3992 | −0.1377 | 0.0491 | 0.0044 | 0.1318 | 0.3764 |
| 2 | Organic manure application | −0.2080 | 0.1710 | −0.1086 | 0.3048 | 0.2754 | 0.3617 | 0.2958 |
| 3 | Allowing land to fallow for natural regeneration to take place | −0.0169 | 0.2944 | −0.0121 | 0.1371 | −0.5092 | −0.3434 | 0.1478 |
| 4 | Boundary planting of wind breakers and shelter belts | 0.0613 | 0.0473 | 0.3986 | 0.4017 | −0.2012 | 0.0001 | 0.1640 |
| 5 | Irrigation | 0.3283 | 0.0099 | −0.0492 | 0.3541 | −0.0264 | 0.0956 | 0.4911 |
| 6 | Rain water harvesting technologies | 0.1674 | 0.3854 | 0.0487 | −0.2927 | 0.0337 | −0.2242 | 0.2867 |
| 7 | Contour | 0.2614 | −0.1161 | −0.1722 | 0.4599 | −0.0530 | −0.1968 | 0.4207 |
| 8 | Up-down slope cultivation | 0.1851 | 0.0577 | 0.4482 | −0.3618 | −0.0662 | 0.0724 | 0.4081 |
| 9 | Cover cropping | −0.1115 | 0.2451 | 0.1671 | 0.0960 | −0.4742 | 0.4929 | 0.1945 |
| 10 | Pasture growing | 0.3315 | 0.1509 | 0.1474 | 0.0260 | 0.1827 | 0.0713 | 0.4702 |
| 11 | Hay management | 0.1569 | 0.4403 | −0.2341 | 0.0291 | 0.3045 | −0.0749 | 0.3989 |
| 12 | De-stocking | 0.3371 | −0.0331 | 0.2132 | −0.1109 | 0.1243 | 0.1830 | 0.4784 |
| 13 | Spraying with acaricide | −0.2346 | 0.2889 | −0.0083 | −0.0447 | 0.2131 | 0.2841 | 0.3024 |
| 14 | Cross-breeding-Hybridization | −0.2495 | 0.1331 | 0.2343 | 0.2717 | 0.1878 | −0.2213 | 0.3457 |
| 15 | Rearing different livestock species (goats, sheep, cattle, donkeys) | 0.2421 | −0.0143 | 0.1764 | 0.2089 | 0.2878 | −0.0872 | 0.2552 |
| 16 | Rotation grazing in pasture lands | −0.1110 | 0.0925 | 0.3792 | 0.0294 | 0.1247 | −0.3531 | 0.1289 |
| 17 | Intercropping/poly culture (multiple crops in an area in a given time) | 0.3416 | −0.0110 | 0.1419 | −0.0140 | −0.1034 | 0.1914 | 0.4503 |
| 18 | Intercropping with leguminous crops | −0.0083 | 0.3583 | −0.2361 | −0.0782 | −0.1958 | −0.1494 | 0.1565 |
| 19 | Crop rotation | −0.1958 | 0.1903 | 0.2699 | 0.0191 | 0.1359 | −0.1060 | 0.2327 |
| 20 | Improved crop varieties | −0.2555 | 0.0675 | 0.2153 | 0.1451 | 0.0496 | 0.1057 | 0.2814 |
| Eigenvalues | 4.3456 | 1.9330 | 1.6176 | 1.4211 | 1.2054 | 1.0017 | ||
| Eigenvalues % Contribution | 21.7300 | 9.6700 | 8.0900 | 7.1100 | 6.0300 | 5.0100 | ||
| Cumulative | 21.7300 | 31.3900 | 39.4800 | 46.5900 | 52.6100 | 57.6200 |
Table 4. List of climate-smart strategies showing clustered-based PCA component allocations.
| Component | Characterizing practices |
|---|---|
| Component 1: Pasture management |
|
| |
| |
| Component 2: Crop yield management |
|
| |
| |
| Component 3: Water management |
|
| |
| Component 4: Soil and water conservation |
|
| |
| |
| Component 5: Livestock management |
|
| |
| Component 6: Weed management |
|
| |
|
Figure 2 shows the results of how commonly each of the CSA practices are used within the study area. The results show that crop yield and disease management are the most commonly used strategies at 96% of the responding adopters, followed by soil and water conservation (95%), and livestock and disease management strategies (93%). Pasture management and water management strategies were the least adopted. The study also showed that it is common practice for farming households to adopt more than one strategy (figure 3). Most were indicated to have adopted at least 2, 3, 4, and 5 strategy combinations (figure 3).
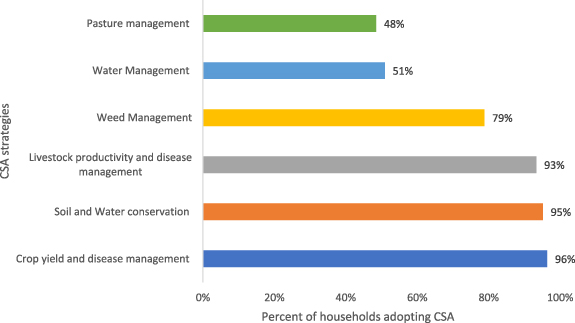
Figure 2. Percentage of households adopting each of the CSA strategies.
Download figure:
Standard image High-resolution image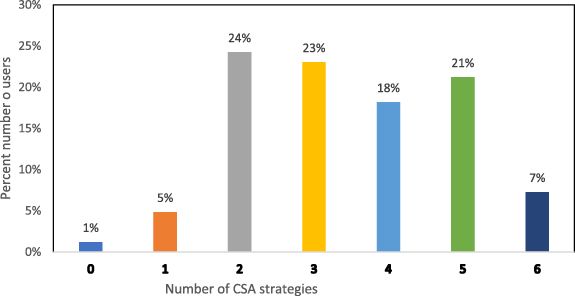
Figure 3. Number of strategies adopted per respondent (This figure describes the portfolio suite of CSA strategies adopted by respondents. In this case, for example, 24% of respondents had adopted/used at least two CSA strategies in their households).
Download figure:
Standard image High-resolution image
3.3. Factors influencing adoption of CSA practices in Nakasongola District, Uganda
Results of the estimated ordered logit model to determine the factors influencing adoption of CSA practices in Nakasongola District are presented in table 5. Generally, adoption of CSA strategies was found to be positively associated with increasing FCS among those that adopted CSA, value of non-livestock assets owned by the household, tropical livestock units owned by the household, and household access to climate change information. On the contrary, adoption of CSA strategies is negatively associated with household engagement in formal employment, household members engaging in off-farm activities, households perception of climate change, such as hailstorms or drought, and household prior experience of crop failure as an effect of climate change.
Table 5. Ordered logit outputs of factors influencing adoption of CSA practices.
| Number CSA strategy combinations adopted | Coef. | Std. err. | Z | P > z |
|---|---|---|---|---|
| FCS | 0.077 | 0.036 | 2.16 | 0.031 |
| Main occupation of household head | ||||
| Crop cultivation | −0.376 | 1.091 | −0.34 | 0.730 |
| Livestock | −2.244 | 1.557 | −1.44 | 0.149 |
| Formal employment | −7.768 | 3.765 | −2.06 | 0.039 |
| Log of asset value | 0.668 | 0.242 | 2.76 | 0.006 |
| Age of the household head (years) | −0.015 | 0.041 | −0.37 | 0.713 |
| Household head is male | 0.141 | 0.709 | 0.20 | 0.842 |
| Household head is married | 1.540 | 1.226 | 1.26 | 0.209 |
| Numbers of years of education completed by head | 0.005 | 0.018 | 0.29 | 0.773 |
| Household has access to credit | 1.610 | 1.042 | 1.55 | 0.122 |
| Tropical livestock units of the household | 0.015 | 0.006 | 2.59 | 0.010 |
| Number of people in the household | −0.220 | 0.184 | −1.20 | 0.230 |
| Household head participates in off farm activities | −1.715 | 0.951 | −1.80 | 0.071 |
| Climate change indicator—hailstorms | −7.327 | 2.656 | −2.76 | 0.006 |
| Climate change indicator—drought | −2.210 | 1.258 | −1.76 | 0.079 |
| Belong to a social group | 0.163 | 0.818 | 0.20 | 0.842 |
| Household has access to climate change information | 3.341 | 1.602 | 2.09 | 0.037 |
| Climate change effect—pasture scarcity | 0.402 | 1.461 | 0.27 | 0.783 |
| Climate change effect—water scarcity | −0.964 | 2.208 | −0.44 | 0.662 |
| Climate change effect—crop failure | −6.779 | 2.191 | −3.09 | 0.002 |
| Distance from home to nearest market | 0.011 | 0.022 | 0.50 | 0.618 |
| Distance from home to the farm | 0.018 | 0.027 | 0.67 | 0.501 |
| Number of observations | 113 | |||
| Likelihood ratio Chi2 (22) | 93.69 | |||
| Prob > Chi2 | 0.000 | |||
| Log likelihood | −50.320 |
FCS is positive and significant (p < 0.05), suggesting a positive relationship between adoption of CSA and household food security. Adoption of CSA strategies increased with increasing FCS. The results further show a positive relationship between non-livestock asset value and adoption of CSA strategies in Nakasongola District. The coefficient on log of asset values is positive and significant, at 1% level of significance. This implies that a 1% increase in asset value increases the log odds of adopting CSA strategies by 0.007 points.
Household access to climate change information is positive and significant (p < 0.05), suggesting that access to climate change related information significantly increases household adoption of CSA strategies. Households accessing climate change-related information are more likely to adopt more CSA strategies than their counterparts, as the log odds of CSA adoption increased by 3.341 times. These results imply that access to climate change-related information is associated with increased adoption of CSA strategies.
The coefficient on household head participation in off farm activities is negative and statistically significant (p < 0.05), suggesting that participation in non-farm income activities significantly decreases household adoption of CSA strategies. Participation in the non-farm sector led to a decrease in CSA strategy adoption, with log odds of 1.715, compared to those not participating (table 5). These results imply that participation in non-farm activities is associated with a lower possibility of adopting CSA strategies.
3.4. Effect of CSA practices on household food security
Tables 6 and 7 provide summaries of FCS disaggregated by adoption regimes and farming categories of the households participating in the study. The results show that in total there are more households (89 = 53%) in the acceptable FCS (>35) compared to other categories. This suggests that 53% of the households in the study area can be considered food secure. Significant differences in FCS are observed comparing adopter and non-adopter as well as pastoral and non-pastoral households. The results further show that 73% of the households in the acceptable FCS category were non-adopters (table 6), thus suggesting that non-adopters are more food secure than their adopting counterparts but those households that adopted CSA experienced positive FCS. Furthermore, 82% of households were from pastoral households (table 6). This suggests that pastoral households (over represented in the non-adopting category (table 1 above), generally are more food secure than their non-pastoral counterparts.
Table 6. Summaries of FCS by adoption regimes.
| Food security category | Non-adopters (n–88) | Adopters (n = 77) | Total |
|---|---|---|---|
| Poor food consumption | 11 (29) | 27 (71) | 38 (100) |
| Borderline food consumption | 12 (32) | 26 (68) | 38 (100) |
| Acceptable food consumption | 65 (73) | 24 (26) | 89 (100) |
Pearson chi2 (2) = 30.1832 Pr = 0.000; figures in brackets are row percentages.
Table 7. Showing summaries of FCS by pastoral categories of households.
| Food security category | Non-pastoral household (n = 50) | Pastoral household (n = 115) | Total |
|---|---|---|---|
| Poor food consumption | 14 (37) | 24 (63) | 38 (100) |
| Borderline food consumption | 20 (53) | 18 (47) | 38 (100) |
| Acceptable food consumption | 16 (18) | 73 (82) | 89 (100) |
Pearson chi2 (2) = 16.1413 Pr = 0.000; figures in brackets are row percentages.
3.4.1. Treatment effect estimates
Results of the expected FCS for adopters and non-adopters of CSA practices as well as their respective counterfactual FCSs are presented in table 8. Results revealed that the expected FCSs of adopters and non-adopters were 53.87 and 66.92 respectively. Comparing (a) and (c) in table 8, reveals that the adopters of CSA practices would have had a significantly lower counterfactual FCS had they not adopted CSA. Therefore, the treatment, (i.e. adoption) has increased expected FCS by 16.12 (42.75%). On the contrary, non-adopters would have experienced decreased FCSs by 0.51 (0.7%) had they adopted CSA practices. The change is, however, marginal and statistically non-significant.
Table 8. FCS of adopters and non-adopters of CSA and their respective counterfactual FCSs.
| Regime | Decision making regime | Treatment effect | T-statistic | |
|---|---|---|---|---|
| Adopt | Not adopt | |||
| Adopters | (a) 53.87 | (c) 37.75 | 16.12 | 1.8096 |
| (0.0744) | ||||
| Non-adopters | (d) 66.41 | (b) 66.92 | −0.51 | −0.257 |
| (0.7975) | ||||
Figures in parentheses are p-values of the T-test results.
4. Discussion
4.1. Climate smart agriculture practices in Nakasongola
The study shows a diversity of CSA practices used in Nakasongola District to generally include those used for soil and water management, weed management, pasture management, livestock productivity and disease management, and crop yield and disease management. Our results showed that crop yield and disease management, soil and water conservation, and livestock and disease management strategies, were the most adopted practices in the study area. Adoption of these practices could be associated with the underlying fact of agro-pastoralism practiced in the area. Additionally, the practices most adopted are associated with those that address the common production constraints in semi-arid areas such as Nakasongola. For example, livestock management CSA practices that improve livestock performance could be preferred because in pastoral and agro-pastoral areas, household wealth is in part held in livestock assets [45]. Meanwhile, the semi-arid locations being water-limited, thus reflecting high demands to improve the harvesting and management of water [46], could explain the relatively high adoption of the soil and water conservation and water management practices in Nakasongola. It is also important to note that the practices adopted indicate the livelihood sources mix occurring in the district with both crop and livestock integration, and at the same time reflect the important constraints, such as water and pasture [47], that affect production in the area. It also appears that community could be responding to the need for a paradigm shift in land along with water and soil nutrients management [48].
The authors observed that adopted CSA practices were used in package combinations with at least two, three, four, and five CSA practices combinations being used by 24%, 23%, 18% and 21% of households respectively. This act of making use of a combination of practices is a risk averting strategy that has evolved through time. Traditionally, in pastoral societies, the application of diverse strategies for risk avoidance, risk escaping, and either or risk management have been deployed over long periods of time. Further, they do so by tapping into indigenous knowledge and find that the prioritization of CSA combinations are better performing and more adaptive to local conditions and farming practices [49]. A combination of CSA practices adoption strategies have been observed in the drylands of Umguza District, Zimbabwe [50]. Considering that the use of combinations is generally within the same margin of adoption and use, it could be indicative of low performance of these CSA technologies. However, it could also be indicative of the need for diverse strategies for a diversified crop and livestock livelihood strategies at household level.
4.2. Factors influencing the adoption of CSA practices
Access to climate information, herd size in terms of TLUs, ownership of non-livestock assets, household food security status, participation in off-farm activities, and household income all influenced the adoption of CSA practices in the study area. Similarly, a study conducted by Mayanja and colleagues revealed that various factors including livelihood system, land ownership, heads of livestock owned, and belonging to a social network explained the variations in food security practices and status among agro-pastoral and pastoral households within the rangeland of Central Ugandan [51]. Investing in non-livestock livelihood assets, such as social institutions, to minimize the risk of destitution and manipulation of local markets among the Afar pastoralists of Ethiopia helped households to exploit their highly marginalized environment [52]. Similarly, it was reported that agro-pastoral households invest more in crop cultivation and mostly keep livestock as an additional insurance against crop failure [53]. The combination of livestock rearing and crop farming constrains the declines in food security and livelihood outcomes.
Earlier studies have reported that access to climate information as well as the form of such information received by farmers influence their choice of which climate adaptation and mitigation measures to undertake [20, 54]. Equally, Egeru reported that the adequate access to climate risk management information amongst farmers has the ability to foster effective climate risk management [55]. Sources of climate information to farmers include radios, community leaders and gatherings, diviners, shrine elders, and humanitarian agencies [55, 56]. On the other hand, farmers have been reported to possess indigenous knowledge on their climate-related perturbations in their environment [57, 58], but need to be supported by information from other advanced sources, such as earth observation [55]. The timely access to climate risk information and other scientific resources, such as improved crop and livestock varieties, is important for the transformation of farmers and adoption of CSA practices [59].
4.3. Effect of adoption of CSA practices on household food security
The findings of this study indicated that more than 53% of the households surveyed were food secure. It has been reported that alleviating the challenges of climate change, food security, agricultural development goals, and poverty in the tropics necessitates enhancing the adaptive capacity, productivity, and reducing emissions from agricultural landscapes [48, 60]. Several scholars have reported that national governments and development partners in developing countries have recently embarked on transforming different agricultural systems via strategies that enhance climate change adaptation and sustainable natural resources management [30, 61]. Contrary to the findings of the current study that that majority of the food secure households were non-CSA adopters. It is important to note that those that had adopted had shown positive outcomes of CSA adoption on FCS. The low number of adopters could be attributed to a gradual penetration of CSA practices. As revealed by the counterfactual effects analysis, had the adopters not adopted, they could have been worse-off in terms of their FCS. This finding lends credence to fact that adoption of CSA practices significantly and positively influences the food security status of adopters [62, 63]. Meanwhile, the non-adopters having a good FCS could be attributed their access to animal protein, mainly milk, on a regular basis, which has a high FCS of four (4). The milk is largely obtained from their practice of agro-pastoralism in which case, milk whose food score drives the nutritional outcomes at household level. This raises the importance of farmers investing in a combination of CSA practices for them to obtain the benefits of adoption of CSA practices on their farms. Indeed, Wekesa and colleagues reported that a combination of CSA practices strongly influenced the contribution of CSA to food security of households in Kenya [63].
The use of CSA practices in both livestock and crop systems have been associated with ensuring increased crop or livestock productivity and providing farmers with extra income that enhances the profitability of their farming enterprises [17, 64]. The findings of this study showed that pastoral households were realizing the benefits of CSA practices more than crop cultivating households. In livestock rearing systems in Zimbabwe, the adoption of silvo-pastoral practices, such as pasture management, and improved livestock disease control have been reported to increase animal products like milk, high quality hides, and beef that enable continuous food security and income generation for farmers [65]. Animal products such as milk and beef contain a high amount of proteins and also have higher FCS compared to carbohydrates from crops such as maize, bean and banana [42]. Therefore, farming households with limited access to intake of animal products such as milk should be advised to integrate crop cultivation with animal rearing, or frequent benefit boost their diet with animal products, in order to increase their food security status. It is also argued that the adoption of CSA practices by various groups of farmers, such as pastoralists and agro-pastoralists, offer ancillary and co-benefits, including increased household income and the reduction of food insecurities [60, 64].
Similar to the findings of this study, Mayanja and colleagues also observed significant variation in the food security status of pastoral and agro-pastoral households found in Central Ugandan rangeland; with the pastoralists having a higher diet diversity due to access to dairy and meat products [51]. Limited consumption of meat and milk products amongst the agro-pastoral household has been associated with a lowering of their FCS [51, 63]. Opposed to the fact that household findings of the current study showed that households involved in off-farm activities were found food insecure. This could be attributed to the fact that most of off-activities were largely casual labour provision and others such as retail trade whose proceeds addressed competing household priorities. However, Lopez-Ridaura and colleagues [62] indicated that resource-poor agricultural casual laborers generating a daily income from off-farm in eastern India were comparatively less vulnerable to the risks of food insecurity compared to full-time and part-time farming households. He further attributed differences in food security vulnerability to the fact that agricultural laborers generating a daily income from off-farm means demonstrate more diversified income sources together with the ability to migrate during simulated droughts in pursuit of work [62]. Therefore, households involved in off-farm activities in the study area could only boost their food security if they are paid sufficient daily wages that can be used to purchase food commodities for their households.
5. Conclusions
CSA adoption among smallholder farmers in Nakasongola is still in its early stages of adoption. Six CSAs including; soil and water management, weed management, pasture management, livestock productivity and disease management, and crop yield and disease management) are being used singularly or in bundles. Accordingly, these CSA options ought to be promoted singularly or through bundled options within communities paying close attention to user category differences. Further, awareness among the providers of extension and agricultural advisory services ought to be raised on the portfolio of CSAs in use to enable targeted and matched dissemination. In addition, the capacity of extension and agricultural advisory services providers ought to be strengthened so that they are well positioned to support farmers as well as pastoralists to identify and utilize CSA portfolio bundles.
Access to climate information, increase in the total tropical livestock units among the households, and possessing a high asset value emerged as key drivers of adoption of CSA. Owing to considerably large proportion of non-adopters, the Government of Uganda, development partners and civil society actors ought to increase the dissemination of CSA information among both crop and livestock-dependent households. Further, supporting the livestock producers and enabling those with a smallholder livestock herd to build and rebuild their herds could offer a continued opportunity for increasing adoption of CSA in the dryland areas of Uganda.
We found a slightly a large proportion of households (53%) being food secure but of these only, 27% were among those that had adopted CSA practices. This raises an issue of interest to the effect that households are having alternative sources of securing food, this could most likely be from off-farm income including from trade, formal employment and remittances It is thus essential for Government of Uganda, civil society and development partners to enhance the evolution of non-farm based alternative livelihood sources. Arising from the fact that crop-cultivating households had lower FCS contrary to the traditionally held view that pastoralists households are perennially food insecure, it is therefore vital that crop producing households are supported to adopt CSA practices that can raise their productivity. It is also important that pastoralists households are equally supported to further adopt CSA practices that enhance their productivity and enhances their ability to continuously access animal proteins especially milk and meat. We also recommend for continued investments enhance sustainable practices of non-adopters and increases the performance of adopters within the dryland environments. Meanwhile, further analysis that tests how the adopters and non-adopters perform in the event of a shock such as a drought, a common cyclic phenomenon in the area needs to be undertaken.
Data availability statement
The data that support the findings of this study are available upon reasonable request from the authors.
Conflict of interest
The authors confirm there is no conflict of interest.
Data access
Data and analysis codes for this work are available upon request from the authors.
Funding state
This work was a result of self-funding.