
CRISPR/Cas9 Mediated Knockout of the OsbHLH024 Transcription Factor Improves Salt Stress Resistance in Rice (Oryza sativa L.)


 , , ,
, , ,  and
and 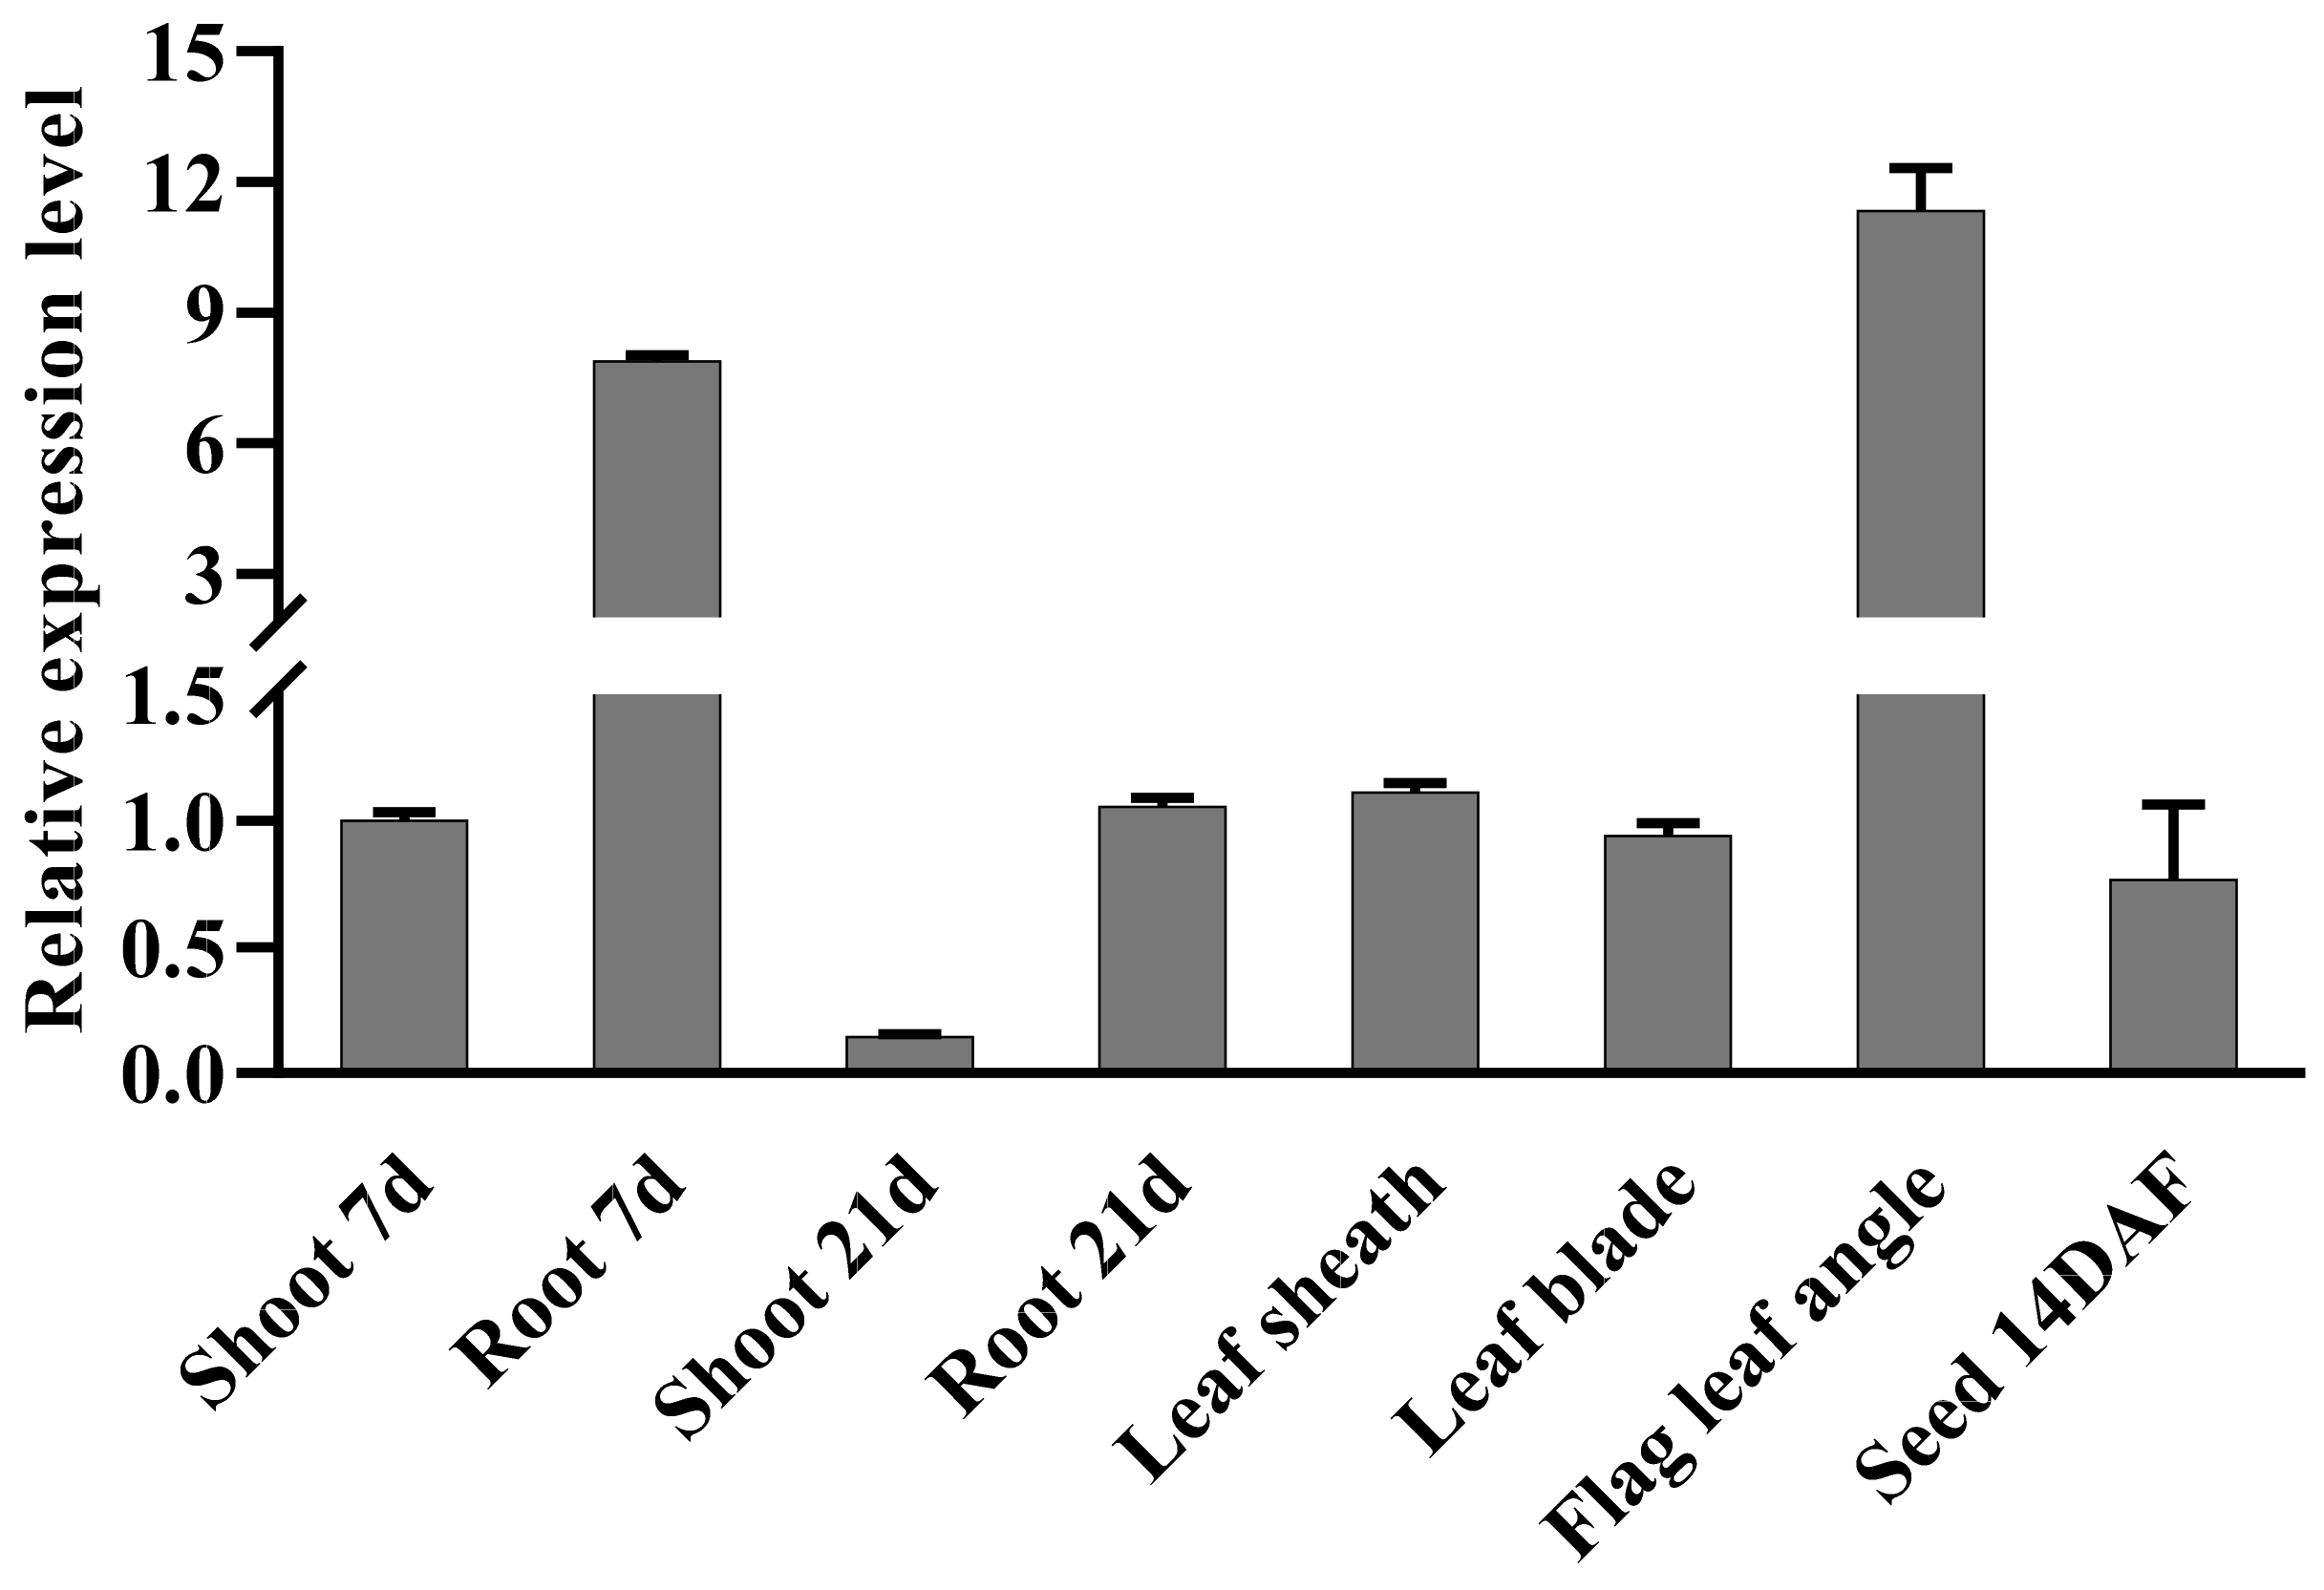
Abstract
:1. Introduction
2. Results
2.1. Expression Level of OsbHLH024
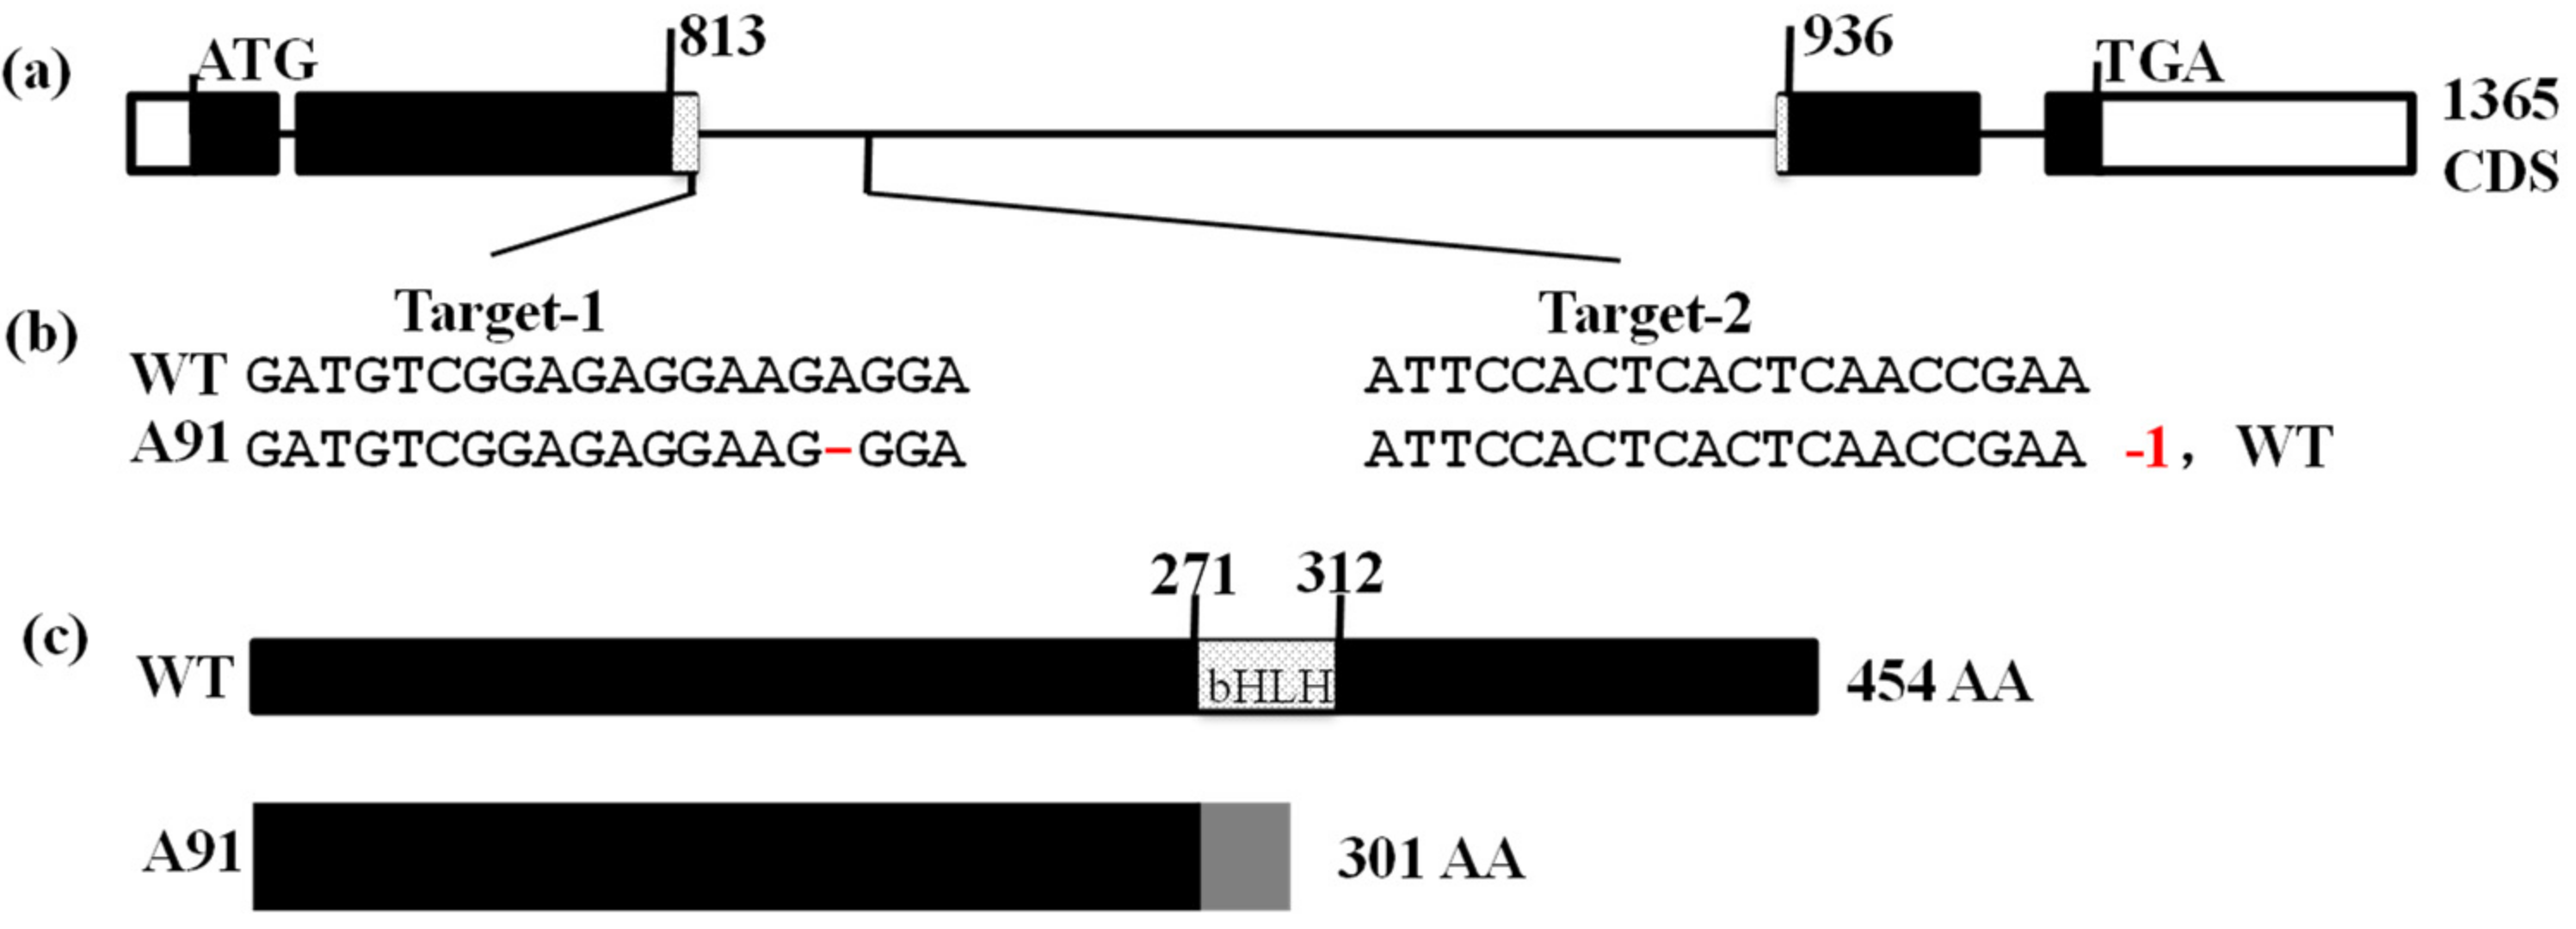
2.2. Generation of A91 via CRISPR/Cas9 Method
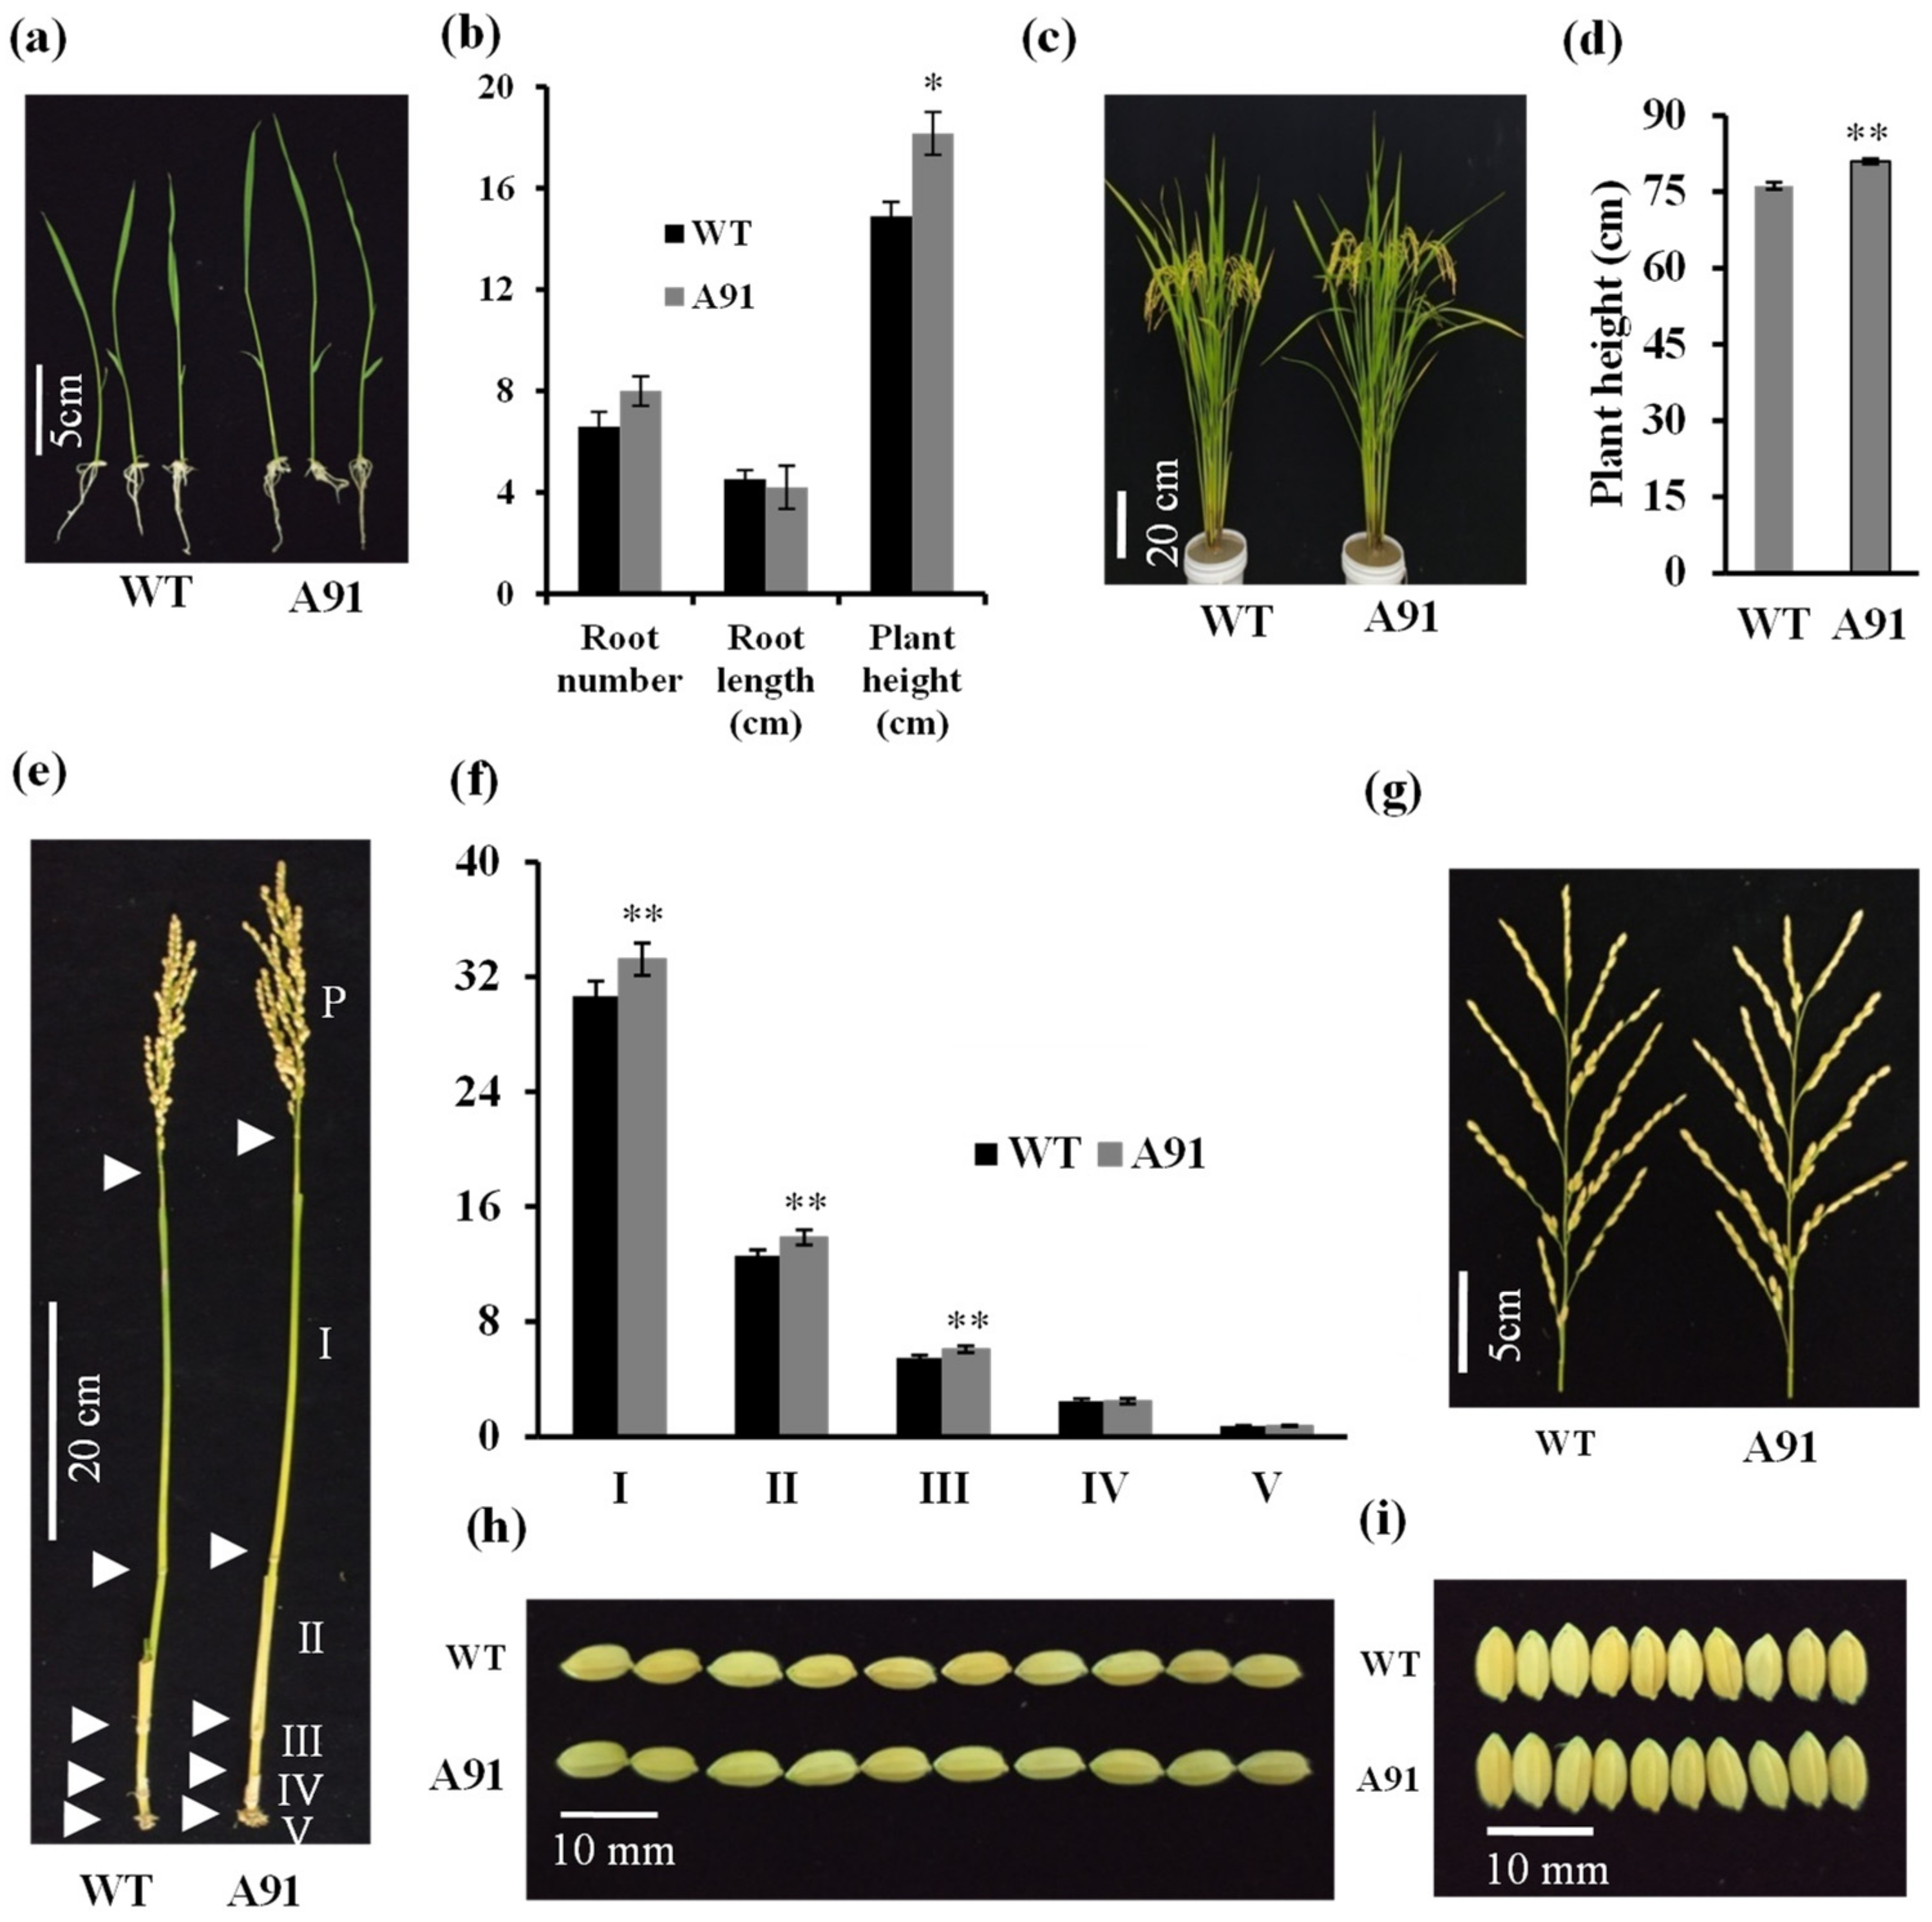
2.3. Phenotypic Characterization of the A91 and WT Grew in Normal Conditions
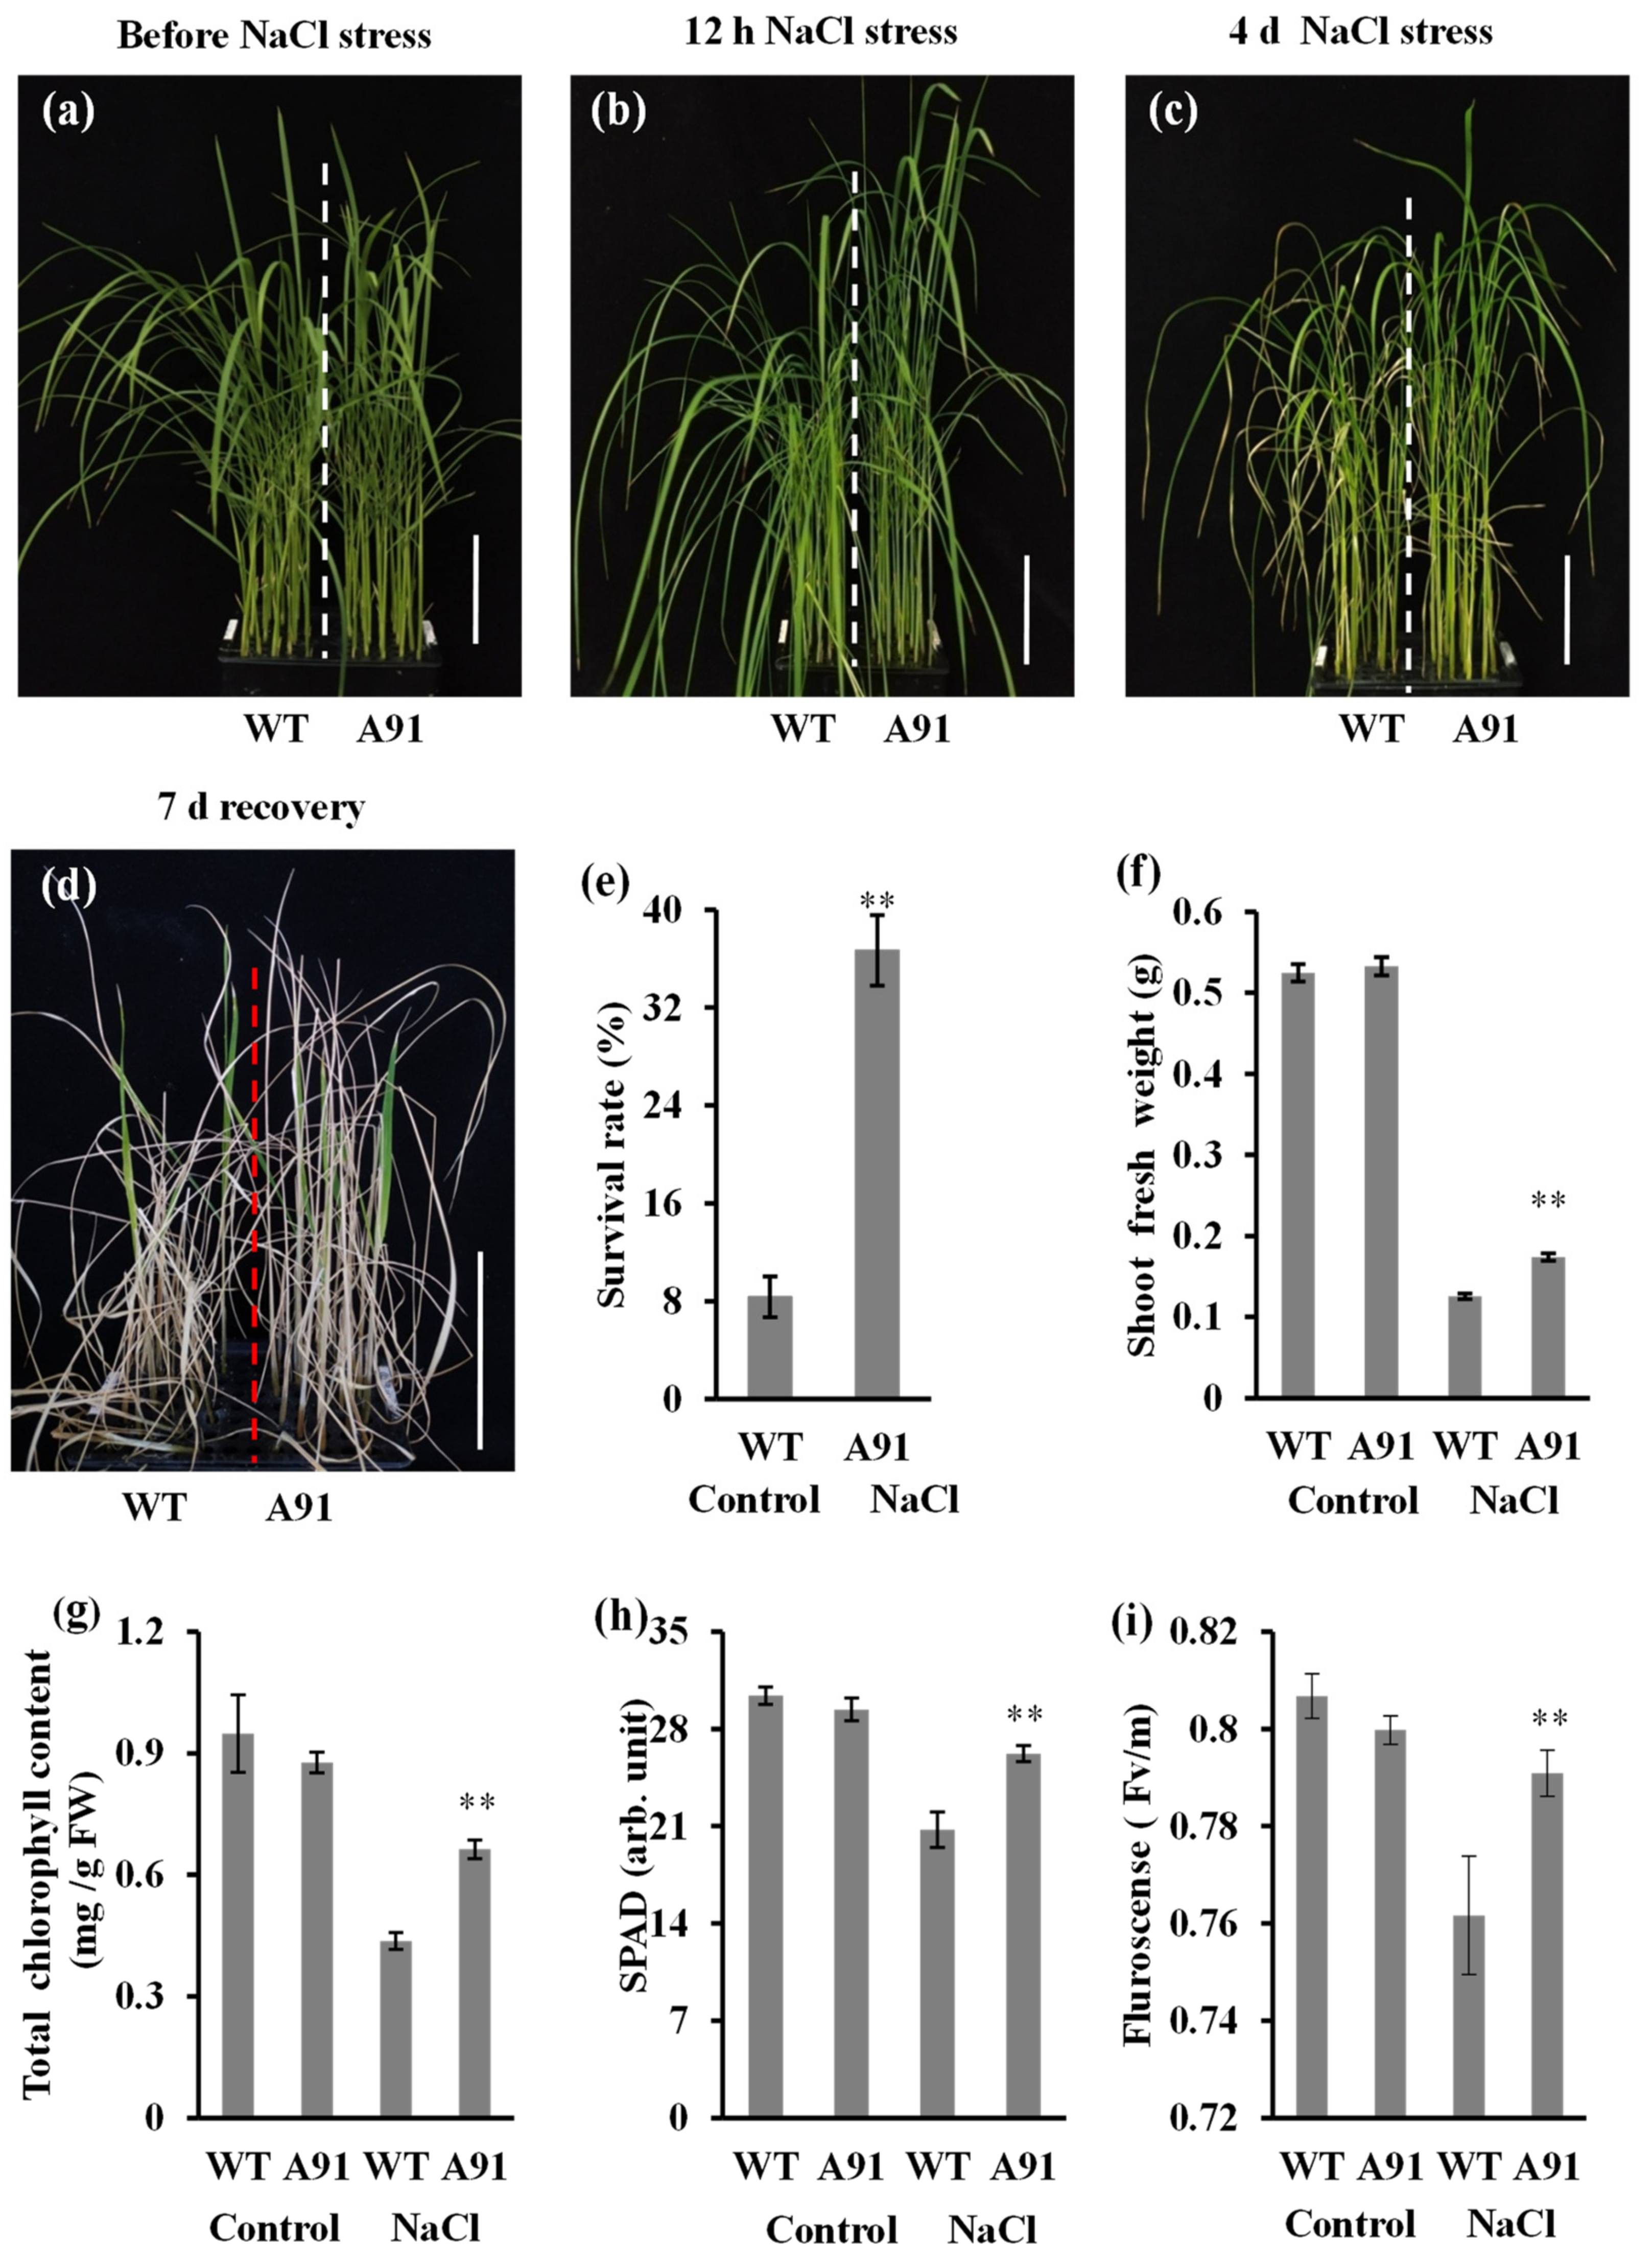
2.4. The A91 Confers Salt Tolerance
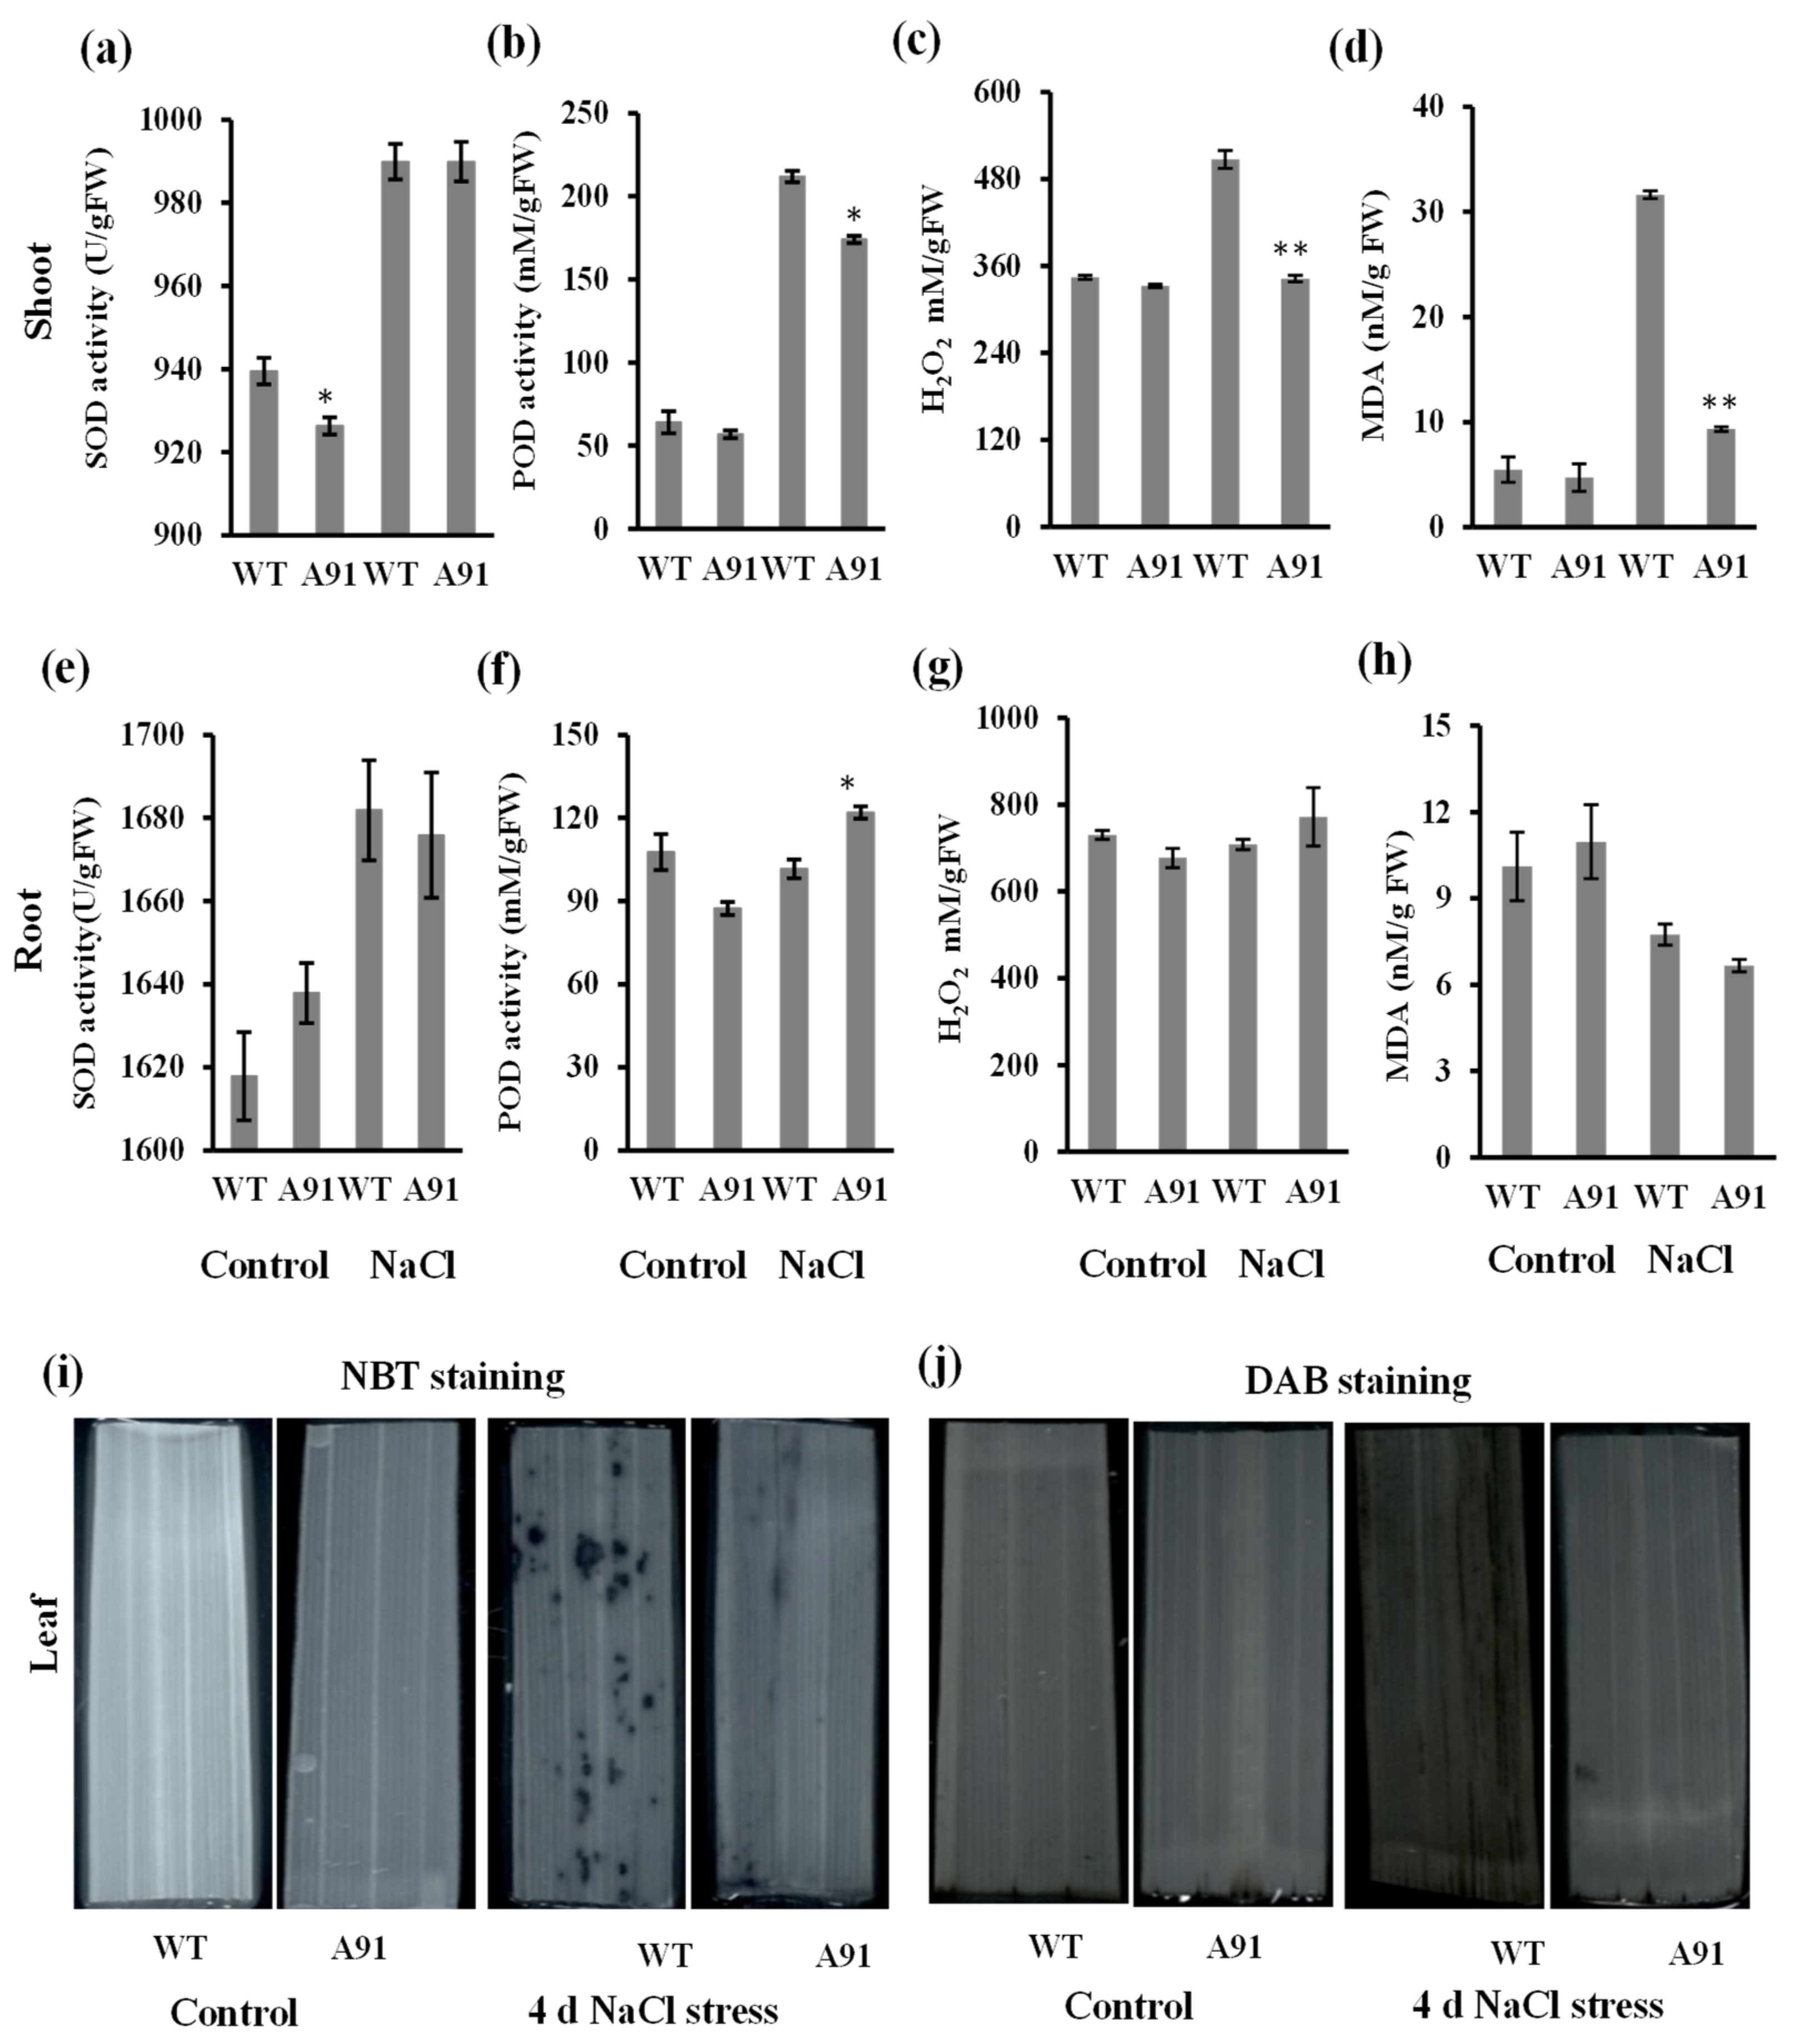
2.5. OsbHLH024 Involves in the Regulation of Oxidative Stress Homeostasis in Salt Stress
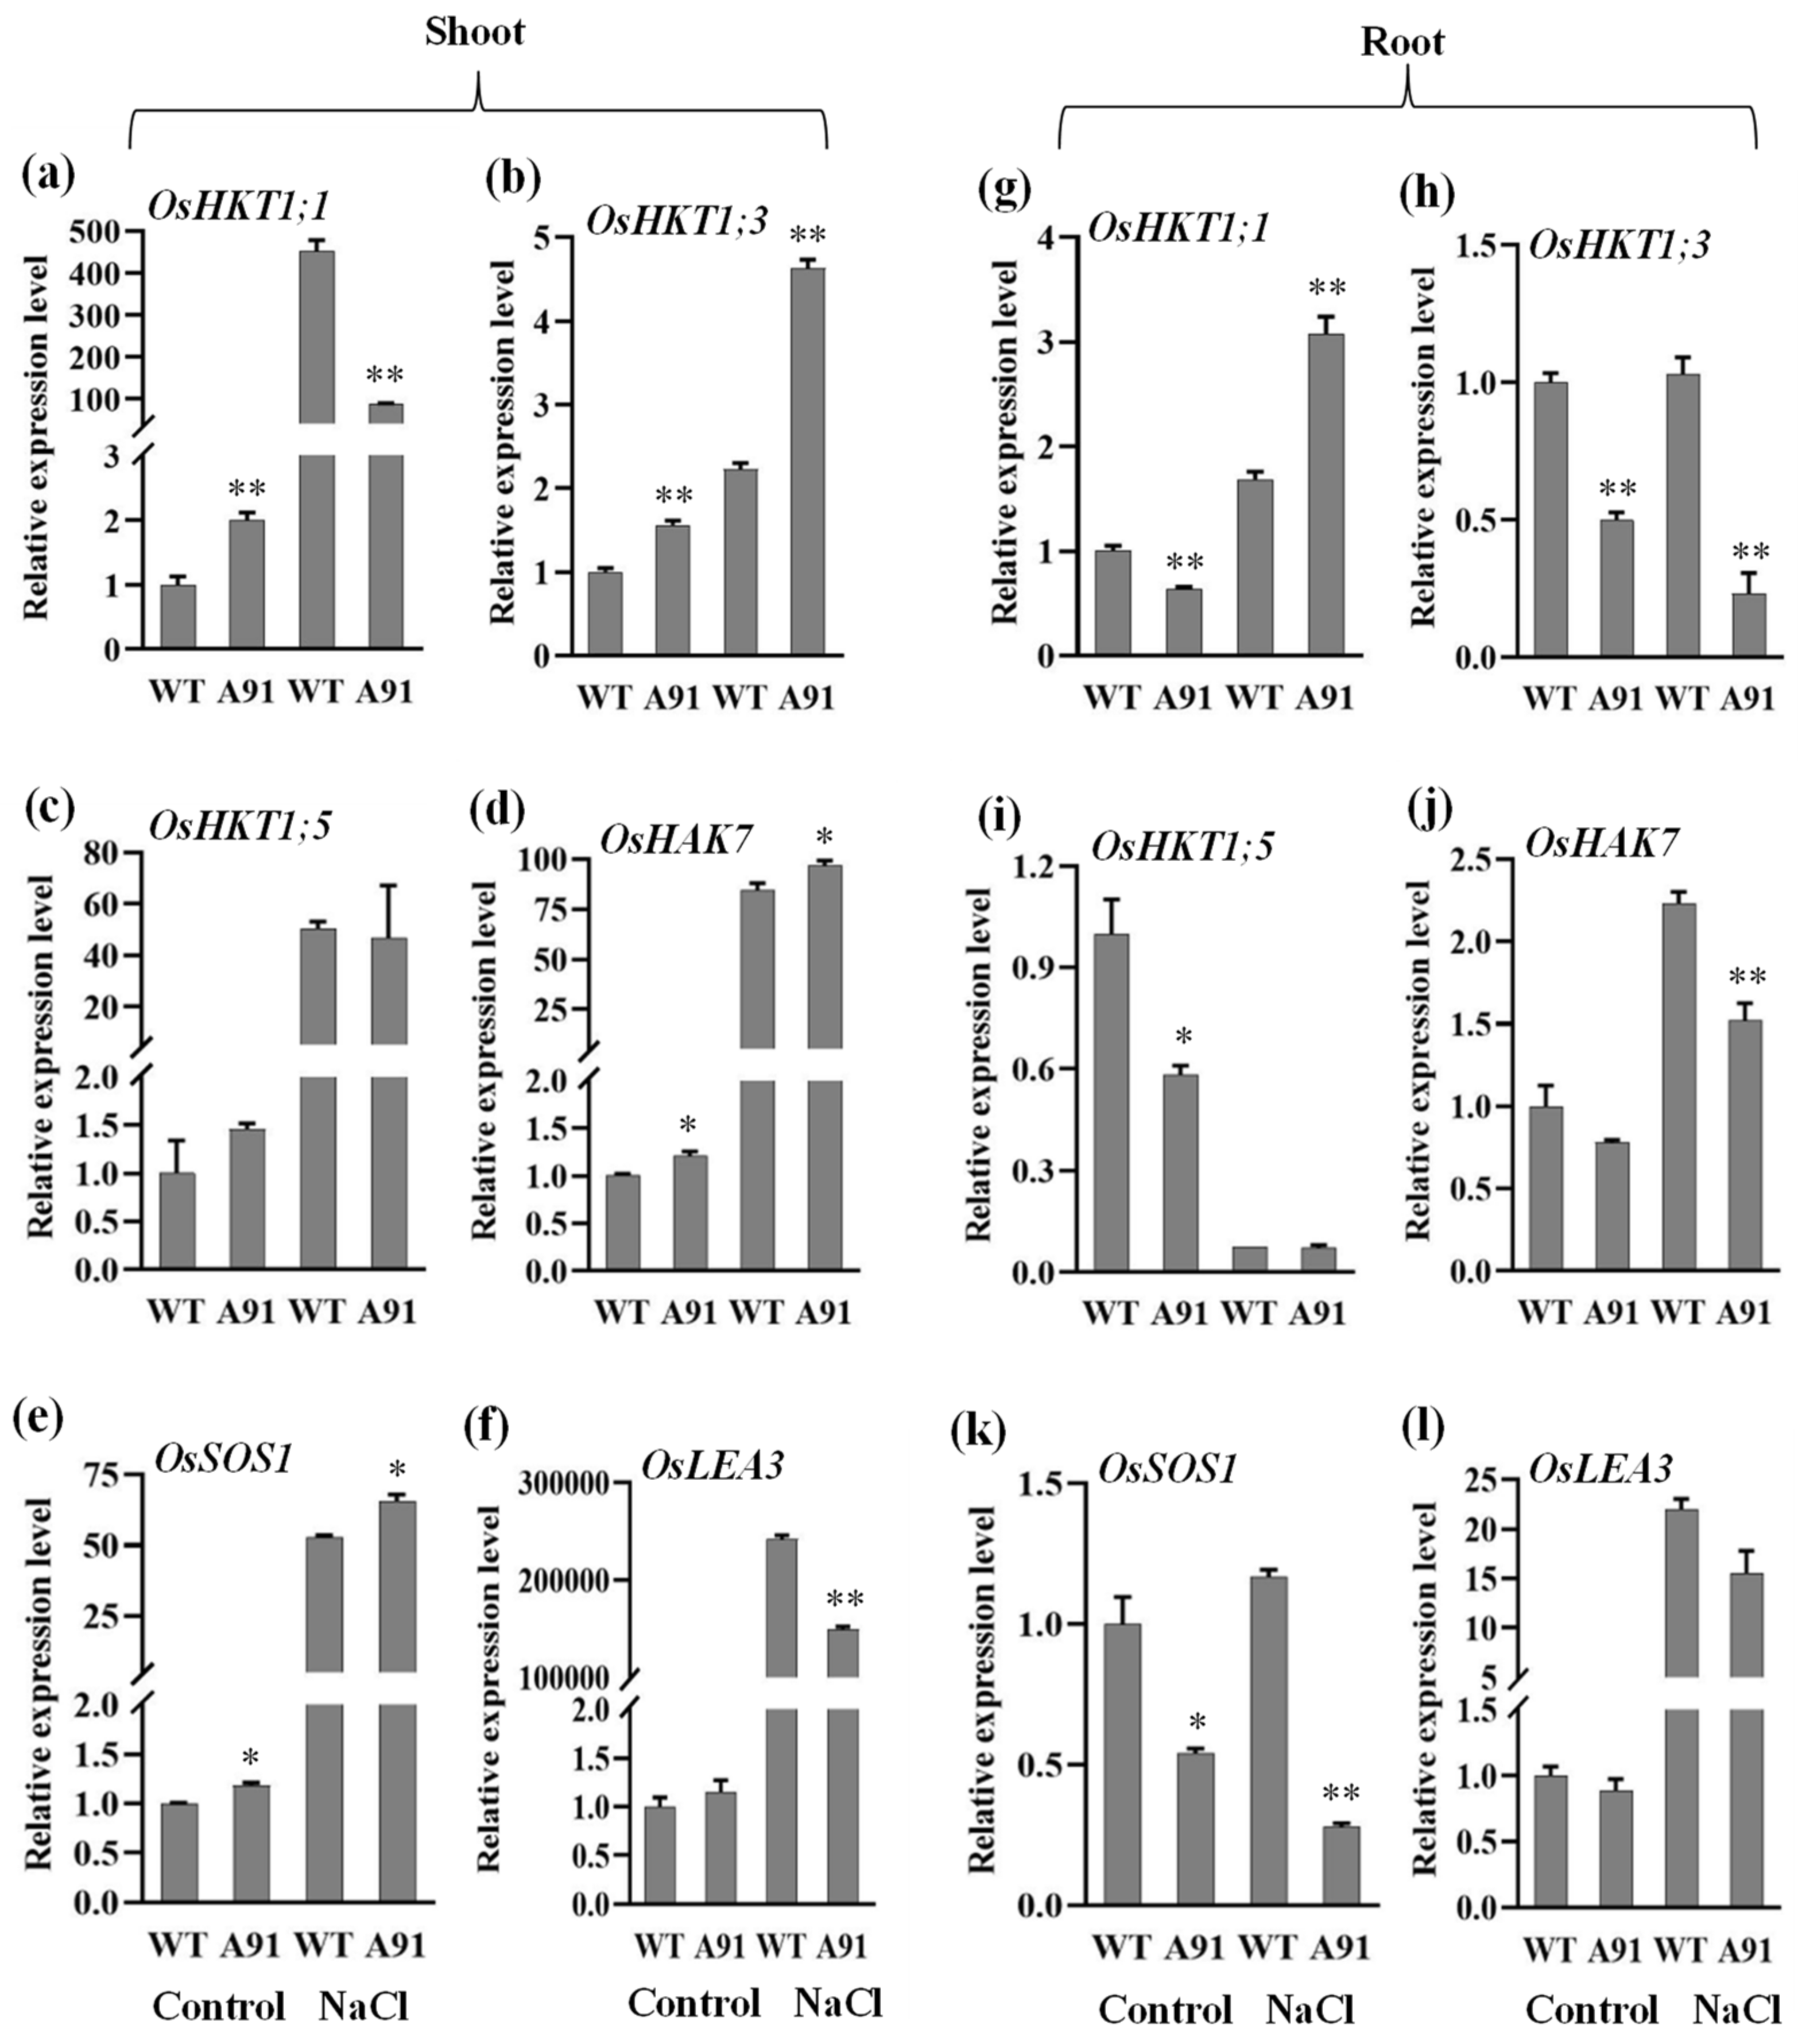
2.6. OsbHLH024 Induces Ion Homeostasis under Salt Stress
2.7. The Molecular Effect of OsbHLH024 Mutation in Ion Transporters and Cell Structure Controller Genes
3. Discussion
4. Materials and Methods
4.1. CRISPR/Cas9 Vector Construction and Rice Transformation
4.2. Mutation Detection and Assay of Transgene-Free Plant Lines
4.3. Phenotypes Observation of the A91 Mutant
4.4. Total Chlorophyll Content and Fluorescence Determination
4.5. Salt Stress Experiments
4.6. Antioxidants Measurements
4.7. Measurements of the Lipid Peroxidation (MDA) and H2O2
4.8. Histochemical Staining
4.9. Gene Expression Analysis
4.10. Elements Analysis
5. Conclusions
Supplementary Materials
Author Contributions
Funding
Institutional Review Board Statement
Informed Consent Statement
Data Availability Statement
Acknowledgments
Conflicts of Interest
References
- Van Zelm, E.; Zhang, Y.; Testerink, C. Salt tolerance mechanisms of plants. Annu. Rev. Plant Biol. 2020, 71, 403–433. [Google Scholar] [CrossRef] [Green Version]
- Munns, R.; Tester, M. Mechanisms of salinity tolerance. Annu. Rev. Plant Biol. 2008, 59, 651–681. [Google Scholar] [CrossRef] [Green Version]
- Hussain, S.; Zhang, J.-H.; Zhong, C.; Zhu, L.-F.; CAO, X.-C.; Yu, S.-M.; Bohr, J.A.; Hu, J.-J.; Jin, Q.-Y. Effects of salt stress on rice growth, development characteristics, and the regulating ways: A review. J. Integr. Agric. 2017, 16, 2357–2374. [Google Scholar] [CrossRef] [Green Version]
- Yang, Y.; Guo, Y. Elucidating the molecular mechanisms mediating plant salt-stress responses. New Phytol. 2018, 217, 523–539. [Google Scholar] [CrossRef] [Green Version]
- Arif, Y.; Singh, P.; Siddiqui, H.; Bajguz, A.; Hayat, S. Salinity induced physiological and biochemical changes in plants: An omic approach towards salt stress tolerance. Plant Physol. Biochem. 2020, 156, 64–77. [Google Scholar] [CrossRef]
- McCord, J.M. The evolution of free radicals and oxidative stress. Am. J. Med. 2000, 108, 652–659. [Google Scholar] [CrossRef]
- Ashraf, M.; Athar, H.; Harris, P.; Kwon, T. Some prospective strategies for improving crop salt tolerance. Adv. Agron. 2008, 97, 45–110. [Google Scholar]
- Gill, S.S.; Tuteja, N. Reactive oxygen species and antioxidant machinery in abiotic stress tolerance in crop plants. Plant Physol.Biochem. 2010, 48, 909–930. [Google Scholar]
- Mittler, R. Oxidative stress, antioxidants and stress tolerance. Trends Plant Sci. 2002, 7, 405–410. [Google Scholar] [CrossRef]
- Miller, G.; Suzuki, N.; Ciftci-Yilmaz, S.; Mittler, R. Reactive oxygen species homeostasis and signalling during drought and salinity stresses. Plant Cell Environ. 2010, 33, 453–467. [Google Scholar] [CrossRef]
- Vaidyanathan, H.; Sivakumar, P.; Chakrabarty, R.; Thomas, G. Scavenging of reactive oxygen species in NaCl-stressed rice (Oryza sativa L.)—differential response in salt-tolerant and sensitive varieties. Plant Sci. 2003, 165, 1411–1418. [Google Scholar] [CrossRef]
- Demiral, T.; Türkan, I. Comparative lipid peroxidation, antioxidant defense systems and proline content in roots of two rice cultivars differing in salt tolerance. Environ. Exp. Bot. 2005, 53, 247–257. [Google Scholar] [CrossRef]
- Racchi, M.L. Antioxidant defenses in plants with attention to Prunus and Citrus spp. Antioxidants 2013, 2, 340–369. [Google Scholar] [CrossRef] [PubMed]
- Gill, S.S.; Anjum, N.A.; Gill, R.; Yadav, S.; Hasanuzzaman, M.; Fujita, M.; Mishra, P.; Sabat, S.C.; Tuteja, N. Superoxide dismutase—Mentor of abiotic stress tolerance in crop plants. Environ. Sci. Pollut. Res. 2015, 22, 10375–10394. [Google Scholar] [CrossRef] [PubMed]
- Razzaque, M.A.; Talukder, N.M.; Islam, M.T.; Dutta, R.K. Salinity effect on mineral nutrient distribution along roots and shoots of rice (Oryza sativa L.) genotypes differing in salt tolerance. Arch. Agron. Soil Sci. 2011, 57, 33–45. [Google Scholar] [CrossRef]
- Rengel, Z. The role of calcium in salt toxicity. Plant Cell Environ. 1992, 15, 625–632. [Google Scholar] [CrossRef]
- Weisany, W.; Sohrabi, Y.; Heidari, G.; Siosemardeh, A.; Badakhshan, H. Effects of zinc application on growth, absorption and distribution of mineral nutrients under salinity stress in soybean (Glycine max L.). J. Plant Nutr. 2014, 37, 2255–2269. [Google Scholar] [CrossRef]
- Amanullah, I.; Inamullah, X. Dry matter partitioning and harvest index differ in rice genotypes with variable rates of phosphorus and zinc nutrition. Rice Sci. 2016, 23, 78–87. [Google Scholar] [CrossRef] [Green Version]
- Shahid, M.A.; Sarkhosh, A.; Khan, N.; Balal, R.M.; Ali, S.; Rossi, L.; Gómez, C.; Mattson, N.; Nasim, W.; Garcia-Sanchez, F. Insights into the Physiological and Biochemical Impacts of Salt Stress on Plant Growth and Development. Agronomy 2020, 10, 938. [Google Scholar] [CrossRef]
- Szymańska, K.P.; Polkowska-Kowalczyk, L.; Lichocka, M.; Maszkowska, J.; Dobrowolska, G. SNF1-related protein kinases SnRK2. 4 and SnRK2. 10 modulate ROS homeostasis in plant response to salt stress. Int. J. Mol. Sci. 2019, 20, 143. [Google Scholar] [CrossRef] [Green Version]
- Hu, T.Z. OsLEA3, a late embryogenesis abundant protein gene from rice, confers tolerance to water deficit and salt stress to transgenic rice. Russ. J. Plant Physiol. 2008, 55, 530–537. [Google Scholar] [CrossRef]
- Kumar, K.; Kumar, M.; Kim, S.-R.; Ryu, H.; Cho, Y.-G. Insights into genomics of salt stress response in rice. Rice 2013, 6, 1–15. [Google Scholar] [CrossRef] [PubMed] [Green Version]
- Blumwald, E.; Aharon, G.S.; Apse, M.P. Sodium transport in plant cells. Biochim. Biophys. Acta Biomembr. 2000, 1465, 140–151. [Google Scholar] [CrossRef] [Green Version]
- Basu, S.; Kumar, A.; Benazir, I.; Kumar, G. Reassessing the role of ion homeostasis for improving salinity tolerance in crop plants. Physiol. Plant. 2021, 171, 502–519. [Google Scholar] [CrossRef] [PubMed]
- Hamamoto, S.; Horie, T.; Hauser, F.; Deinlein, U.; Schroeder, J.I.; Uozumi, N. HKT transporters mediate salt stress resistance in plants: From structure and function to the field. Curr. Opin. Biotechnol. 2015, 32, 113–120. [Google Scholar] [CrossRef] [Green Version]
- Almeida, P.; Katschnig, D.; De Boer, A.H. HKT transporters—State of the art. Int. J. Mol. Sci. 2013, 14, 20359–20385. [Google Scholar] [CrossRef] [Green Version]
- Garciadeblás, B.; Senn, M.E.; Bañuelos, M.A.; Rodríguez-Navarro, A. Sodium transport and HKT transporters: The rice model. Plant J. 2003, 34, 788–801. [Google Scholar] [CrossRef]
- Wang, R.; Jing, W.; Xiao, L.; Jin, Y.; Shen, L.; Zhang, W. The rice high-affinity potassium transporter1; 1 is involved in salt tolerance and regulated by an MYB-type transcription factor. Plant Physiol. 2015, 168, 1076–1090. [Google Scholar] [CrossRef] [Green Version]
- Anwar, A.; Kim, J.-K. Transgenic breeding approaches for improving abiotic stress tolerance: Recent progress and future perspectives. Int. J. Mol. Sci. 2020, 21, 2695. [Google Scholar] [CrossRef] [Green Version]
- Rosas-Santiago, P.; Lagunas-Gómez, D.; Barkla, B.J.; Vera-Estrella, R.; Lalonde, S.; Jones, A.; Frommer, W.B.; Zimmermannova, O.; Sychrová, H.; Pantoja, O. Identification of rice cornichon as a possible cargo receptor for the Golgi-localized sodium transporter OsHKT1; 3. J. Exp. Bot. 2015, 66, 2733–2748. [Google Scholar] [CrossRef]
- Mishra, P.; Mishra, V.; Singh, N.K.; Rai, V. Gene expression dynamics of HKT family genes in salt-tolerant and salt-sensitive indica rice cultivars. Indian J. Genet 2017, 77, 364–370. [Google Scholar] [CrossRef]
- Kobayashi, N.I.; Yamaji, N.; Yamamoto, H.; Okubo, K.; Ueno, H.; Costa, A.; Tanoi, K.; Matsumura, H.; Fujii-Kashino, M.; Horiuchi, T. OsHKT1; 5 mediates Na+ exclusion in the vasculature to protect leaf blades and reproductive tissues from salt toxicity in rice. Plant J. 2017, 91, 657–670. [Google Scholar] [CrossRef] [PubMed] [Green Version]
- Horie, T.; Costa, A.; Kim, T.H.; Han, M.J.; Horie, R.; Leung, H.Y.; Miyao, A.; Hirochika, H.; An, G.; Schroeder, J.I. Rice OsHKT2; 1 transporter mediates large Na+ influx component into K+-starved roots for growth. EMBO J. 2007, 26, 3003–3014. [Google Scholar] [CrossRef] [PubMed] [Green Version]
- Okada, T.; Nakayama, H.; Shinmyo, A.; Yoshida, K. Expression of OsHAK genes encoding potassium ion transporters in rice. Plant Biotechnol.-Nar. 2008, 25, 241–245. [Google Scholar] [CrossRef] [Green Version]
- Shi, H.; Ishitani, M.; Kim, C.; Zhu, J.-K. The Arabidopsis thaliana salt tolerance gene SOS1 encodes a putative Na+/H+ antiporter. Proc. Natl. Acad. Sci. USA 2000, 97, 6896–6901. [Google Scholar] [CrossRef] [Green Version]
- Wang, H.; Wang, H.; Shao, H.; Tang, X. Recent Advances in Utilizing Transcription Factors to Improve Plant Abiotic Stress Tolerance by Transgenic Technology. Front. Plant Sci. 2016, 7, 67. [Google Scholar] [CrossRef] [Green Version]
- Latchman, D.S. Transcription factors: An overview. Int. J. Exp. Pathol. 1993, 74, 417. [Google Scholar] [CrossRef] [Green Version]
- Chen, W.J.; Zhu, T. Networks of transcription factors with roles in environmental stress response. Trends Plant Sci. 2004, 9, 591–596. [Google Scholar] [CrossRef]
- Li, X.; Duan, X.; Jiang, H.; Sun, Y.; Tang, Y.; Yuan, Z.; Guo, J.; Liang, W.; Chen, L.; Yin, J.; et al. Genome-wide analysis of basic/helix-loop-helix transcription factor family in rice and Arabidopsis. Plant Physiol. 2006, 141, 1167–1184. [Google Scholar] [CrossRef] [Green Version]
- Guo, J.; Sun, B.; He, H.; Zhang, Y.; Tian, H.; Wang, B. Current Understanding of bHLH Transcription Factors in Plant Abiotic Stress Tolerance. Int. J. Mol. Sci. 2021, 22, 4921. [Google Scholar] [CrossRef]
- Jiang, Y.; Yang, B.; Deyholos, M.K. Functional characterization of the Arabidopsis bHLH92 transcription factor in abiotic stress. Mol. Genet. Genom. 2009, 282, 503–516. [Google Scholar] [CrossRef] [PubMed]
- Chen, H.-C.; Hsieh-Feng, V.; Liao, P.-C.; Cheng, W.-H.; Liu, L.-Y.; Yang, Y.-W.; Lai, M.-H.; Chang, M.-C. The function of OsbHLH068 is partially redundant with its homolog, AtbHLH112, in the regulation of the salt stress response but has opposite functions to control flowering in Arabidopsis. Plant Mol. Biol. 2017, 94, 531–548. [Google Scholar] [CrossRef] [PubMed] [Green Version]
- Kavas, M.; Baloğlu, M.C.; Atabay, E.S.; Ziplar, U.T.; Daşgan, H.Y.; Ünver, T. Genome-wide characterization and expression analysis of common bean bHLH transcription factors in response to excess salt concentration. Mol. Genet. Genom. 2016, 291, 129–143. [Google Scholar] [CrossRef] [PubMed]
- Wang, F.; Zhu, H.; Chen, D.; Li, Z.; Peng, R.; Yao, Q. A grape bHLH transcription factor gene, VvbHLH1, increases the accumulation of flavonoids and enhances salt and drought tolerance in transgenic Arabidopsis thaliana. Plant Cell Tissue Organ Cult. (PCTOC) 2016, 125, 387–398. [Google Scholar] [CrossRef]
- Wang, Y.; Wang, S.; Tian, Y.; Wang, Q.; Chen, S.; Li, H.; Ma, C.; Li, H. Functional Characterization of a Sugar Beet BvbHLH93 Transcription Factor in Salt Stress Tolerance. Int. J. Mol. Sci. 2021, 22, 3669. [Google Scholar] [CrossRef]
- Song, Y.; Li, S.; Sui, Y.; Zheng, H.; Han, G.; Sun, X.; Yang, W.; Wang, H.; Zhuang, K.; Kong, F. SbbHLH85, a bHLH Member, Modulates Resilience to Salt Stress By Regulating Root Hair Growth in Sweet Sorghum. Theor. Appl. Genet. 2021, 135, 201–216. [Google Scholar] [CrossRef]
- Liu, D.; Li, Y.-Y.; Zhou, Z.-C.; Xiang, X.; Liu, X.; Wang, J.; Hu, Z.-R.; Xiang, S.-P.; Li, W.; Xiao, Q.-Z. Tobacco transcription factor bHLH123 improves salt tolerance by activating NADPH oxidase NtRbohE expression. Plant Physiol. 2021, 186, 1706–1720. [Google Scholar] [CrossRef]
- Chen, H.-C.; Cheng, W.-H.; Hong, C.-Y.; Chang, Y.-S.; Chang, M.-C. The transcription factor OsbHLH035 mediates seed germination and enables seedling recovery from salt stress through ABA-dependent and ABA-independent pathways, respectively. Rice 2018, 11, 50. [Google Scholar] [CrossRef]
- Wu, H.; Ye, H.; Yao, R.; Zhang, T.; Xiong, L. OsJAZ9 acts as a transcriptional regulator in jasmonate signaling and modulates salt stress tolerance in rice. Plant Sci. 2015, 232, 1–12. [Google Scholar] [CrossRef]
- Li, C.; Tao, R.-F.; Li, Y.; Duan, M.-H.; Xu, J.-H. Transcriptome analysis of the thermosensitive genic male-sterile line provides new insights into fertility alteration in rice (Oryza sativa). Genomics 2020, 112, 2119–2129. [Google Scholar] [CrossRef]
- Ma, X.; Zhang, Q.; Zhu, Q.; Liu, W.; Chen, Y.; Qiu, R.; Wang, B.; Yang, Z.; Li, H.; Lin, Y. A robust CRISPR/Cas9 system for convenient, high-efficiency multiplex genome editing in monocot and dicot plants. Mol. Plant 2015, 8, 1274–1284. [Google Scholar] [CrossRef] [PubMed]
- Hussain, S.; Shaukat, M.; Ashraf, M.; Zhu, C.; Jin, Q.; Zhang, J. Salinity stress in arid and semi-arid climates: Effects and management in field crops. Clim. Chang. Agric. 2019, 13. [Google Scholar] [CrossRef] [Green Version]
- Sudhir, P.; Murthy, S. Effects of salt stress on basic processes of photosynthesis. Photosynthetica 2004, 42, 481–486. [Google Scholar] [CrossRef]
- Acosta-Motos, J.R.; Ortuño, M.F.; Bernal-Vicente, A.; Diaz-Vivancos, P.; Sanchez-Blanco, M.J.; Hernandez, J.A. Plant responses to salt stress: Adaptive mechanisms. Agronomy 2017, 7, 18. [Google Scholar] [CrossRef] [Green Version]
- Jadamba, C.; Kang, K.; Paek, N.-C.; Lee, S.I.; Yoo, S.-C. Overexpression of rice expansin7 (Osexpa7) confers enhanced tolerance to salt stress in rice. Int. J. Mol. Sci. 2020, 21, 454. [Google Scholar] [CrossRef] [PubMed] [Green Version]
- Zhou, Y.B.; Liu, C.; Tang, D.Y.; Yan, L.; Wang, D.; Yang, Y.Z.; Gui, J.S.; Zhao, X.Y.; Li, L.G.; Tang, X.D.; et al. The Receptor-Like Cytoplasmic Kinase STRK1 Phosphorylates and Activates CatC, Thereby Regulating H2O2 Homeostasis and Improving Salt Tolerance in Rice. Plant Cell 2018, 30, 1100–1118. [Google Scholar] [CrossRef] [Green Version]
- Khan, S.A.; Li, M.Z.; Wang, S.M.; Yin, H.J. Revisiting the role of plant transcription factors in the battle against abiotic stress. Int. J. Mol. Sci. 2018, 19, 1634. [Google Scholar] [CrossRef] [Green Version]
- Sun, X.; Chen, F.; Yuan, L.; Mi, G. The physiological mechanism underlying root elongation in response to nitrogen deficiency in crop plants. Planta 2020, 251, 84. [Google Scholar] [CrossRef]
- Das, K.; Roychoudhury, A. Reactive oxygen species (ROS) and response of antioxidants as ROS-scavengers during environmental stress in plants. Front. Environ. Sci. 2014, 2, 53. [Google Scholar] [CrossRef] [Green Version]
- Hasanuzzaman, M.; Bhuyan, M.; Parvin, K.; Bhuiyan, T.F.; Anee, T.I.; Nahar, K.; Hossen, M.; Zulfiqar, F.; Alam, M.; Fujita, M. Regulation of ROS metabolism in plants under environmental stress: A review of recent experimental evidence. Int. J. Mol. Sci. 2020, 21, 8695. [Google Scholar] [CrossRef]
- Martínez-Atienza, J.; Jiang, X.; Garciadeblas, B.; Mendoza, I.; Zhu, J.-K.; Pardo, J.M.; Quintero, F.J. Conservation of the salt overly sensitive pathway in rice. Plant Physiol. 2007, 143, 1001–1012. [Google Scholar] [CrossRef] [PubMed] [Green Version]
- Cramer, G.; Läuchli, A.; Polito, V. Displacement of Ca2+ and Na+ form the plasma lemma of root cells. Plant Physiol 1985, 79, 207–211. [Google Scholar] [CrossRef] [PubMed] [Green Version]
- Shabala, S.; Demidchik, V.; Shabala, L.; Cuin, T.A.; Smith, S.J.; Miller, A.J.; Davies, J.M.; Newman, I.A. Extracellular Ca2+ ameliorates NaCl-induced K+ loss from Arabidopsis root and leaf cells by controlling plasma membrane K+-permeable channels. Plant Physool. 2006, 141, 1653–1665. [Google Scholar] [CrossRef] [PubMed] [Green Version]
- Quintero, F.J.; Ohta, M.; Shi, H.; Zhu, J.-K.; Pardo, J.M. Reconstitution in yeast of the Arabidopsis SOS signaling pathway for Na+ homeostasis. Proc. Natl. Acad. Sci. USA 2002, 99, 9061–9066. [Google Scholar] [CrossRef] [Green Version]
- Lin, F.; Li, S.; Wang, K.; Tian, H.; Gao, J.; Zhao, Q.; Du, C. A leucine-rich repeat receptor-like kinase, OsSTLK, modulates salt tolerance in rice. Plant Sci. 2020, 296, 110465. [Google Scholar] [CrossRef]
- Lou, D.; Wang, H.; Yu, D. The sucrose non-fermenting-1-related protein kinases SAPK1 and SAPK2 function collaboratively as positive regulators of salt stress tolerance in rice. BMC Plant Biol. 2018, 18, 203. [Google Scholar] [CrossRef] [Green Version]
- Wang, J.; Nan, N.; Li, N.; Liu, Y.; Wang, T.J.; Hwang, I.; Liu, B.; Xu, Z.Y. A DNA Methylation Reader-Chaperone Regulator-Transcription Factor Complex Activates OsHKT1;5 Expression during Salinity Stress. Plant Cell 2020, 32, 3535–3558. [Google Scholar] [CrossRef]
- Munns, R. Genes and salt tolerance: Bringing them together. New Phytol. 2005, 167, 645–663. [Google Scholar] [CrossRef]
- Zhang, J.-L.; Flowers, T.J.; Wang, S.-M. Mechanisms of sodium uptake by roots of higher plants. Plant Soil 2010, 326, 45–60. [Google Scholar] [CrossRef]
- Uozumi, N.; Kim, E.J.; Rubio, F.; Yamaguchi, T.; Muto, S.; Tsuboi, A.; Bakker, E.P.; Nakamura, T.; Schroeder, J.I. The Arabidopsis HKT1 gene homolog mediates inward Na+ currents in Xenopus laevis oocytes and Na+ uptake in Saccharomyces cerevisiae. Plant Physiol. 2000, 122, 1249–1260. [Google Scholar] [CrossRef] [Green Version]
- Campbell, M.T.; Bandillo, N.; Al Shiblawi, F.R.A.; Sharma, S.; Liu, K.; Du, Q.; Schmitz, A.J.; Zhang, C.; Véry, A.-A.; Lorenz, A.J. Allelic variants of OsHKT1; 1 underlie the divergence between indica and japonica subspecies of rice (Oryza sativa) for root sodium content. PLoS Genet. 2017, 13, e1006823. [Google Scholar] [CrossRef] [PubMed]
- Mekawy, A.M.M.; Assaha, D.V.; Yahagi, H.; Tada, Y.; Ueda, A.; Saneoka, H. Growth, physiological adaptation, and gene expression analysis of two Egyptian rice cultivars under salt stress. Plant Physiol. Biochem. 2015, 87, 17–25. [Google Scholar] [CrossRef] [PubMed]
- Møller, I.S.; Gilliham, M.; Jha, D.; Mayo, G.M.; Roy, S.J.; Coates, J.C.; Haseloff, J.; Tester, M. Shoot Na+ exclusion and increased salinity tolerance engineered by cell type–specific alteration of Na+ transport in Arabidopsis. Plant Cell 2009, 21, 2163–2178. [Google Scholar] [CrossRef] [PubMed] [Green Version]
- Rus, A.; Yokoi, S.; Sharkhuu, A.; Reddy, M.; Lee, B.-H.; Matsumoto, T.K.; Koiwa, H.; Zhu, J.-K.; Bressan, R.A.; Hasegawa, P.M. AtHKT1 is a salt tolerance determinant that controls Na+ entry into plant roots. Proc. Natl. Acad. Sci. USA 2001, 98, 14150–14155. [Google Scholar] [CrossRef] [PubMed] [Green Version]
- Fang, C.; Li, K.; Wu, Y.; Wang, D.; Zhou, J.; Liu, X.; Li, Y.; Jin, C.; Liu, X.; Mur, L.A.J. OsTSD2-mediated cell wall modification affects ion homeostasis and salt tolerance. Plant, Cell Environ. 2019, 42, 1503–1512. [Google Scholar] [CrossRef]
- He, X.; Li, L.; Xu, H.; Xi, J.; Cao, X.; Xu, H.; Rong, S.; Dong, Y.; Wang, C.; Chen, R. A rice jacalin-related mannose-binding lectin gene, Os JRL, enhances Escherichia coli viability under high salinity stress and improves salinity tolerance of rice. Plant Biol. 2017, 19, 257–267. [Google Scholar] [CrossRef] [PubMed]
- Liu, X.; Wu, D.; Shan, T.; Xu, S.; Qin, R.; Li, H.; Negm, M.; Wu, D.; Li, J. The trihelix transcription factor OsGTγ-2 is involved adaption to salt stress in rice. Plant Mol. Biol. 2020, 103, 545–560. [Google Scholar] [CrossRef]
- Wang, W.-C.; Lin, T.-C.; Kieber, J.; Tsai, Y.-C. Response regulators 9 and 10 negatively regulate salinity tolerance in rice. Plant Cell Physiol. 2019, 60, 2549–2563. [Google Scholar] [CrossRef]
- Wang, Y.; Li, D.; Gao, J.; Li, X.; Zhang, R.; Jin, X.; Hu, Z.; Zheng, B.; Persson, S.; Chen, P. The 2′-O-methyladenosine nucleoside modification gene OsTRM13 positively regulates salt stress tolerance in rice. J. Experimet. Bot. 2017, 68, 1479–1491. [Google Scholar] [CrossRef]
- Banuelos, M.A.; Garciadeblas, B.; Cubero, B.; Rodrıguez-Navarro, A. Inventory and functional characterization of the HAK potassium transporters of rice. Plant Physiol. 2002, 130, 784–795. [Google Scholar] [CrossRef] [Green Version]
- Chuamnakthong, S.; Nampei, M.; Ueda, A. Characterization of Na+ exclusion mechanism in rice under saline-alkaline stress conditions. Plant Sci. 2019, 287, 110171. [Google Scholar] [CrossRef] [PubMed]
- Imran, S.; Tsuchiya, Y.; Tran, S.T.H.; Katsuhara, M. Identification and Characterization of Rice OsHKT1; 3 Variants. Plants 2021, 10, 2006. [Google Scholar] [CrossRef] [PubMed]
- Brown, P.H.; Cakmak, I.; Zhang, Q. Form and function of zinc plants. In Zinc in Soils and Plants; Springer: Berlin/Heidelberg, Germany, 1993; pp. 93–106. [Google Scholar]
- Manjula, M.; Kumari, N.V. Effect of Drought on the Growth and Development of Mulberry. Int. J. Appl. Res. 2017, 12, 339–355. [Google Scholar]
- Gholizadeh, A.; Amin, M.; Anuar, A.; Aimrun, W. Evaluation of SPAD chlorophyll meter in two different rice growth stages and its temporal variability. Eur. J. Sci. Res. 2009, 37, 591–598. [Google Scholar]
- Cai, K.; Chen, X.; Han, Z.; Wu, X.; Zhang, S.; Li, Q.; Nazir, M.M.; Zhang, G.; Zeng, F. Screening of worldwide barley collection for drought tolerance: The assessment of various physiological measures as the selection criteria. Front. Plant Sci. 2020, 11, 1159. [Google Scholar] [CrossRef] [PubMed]
- Coronel, V.; Akita, S.; Yoshida, S. Aluminium toxicity tolerance in rice (Oryza sativa) seedlings. In Plant nutrition—Physiology and Applications; Springer: Berlin/Heidelberg, Germany, 1990; pp. 357–363. [Google Scholar]
- Zhou, W.; Leul, M. Uniconazole-induced tolerance of rape plants to heat stress in relation to changes in hormonal levels, enzyme activities and lipid peroxidation. Plant Growth Regul. 1999, 27, 99–104. [Google Scholar] [CrossRef]
- Giannopolitis, C.N.; Ries, S.K. Superoxide dismutases: I. Occurrence in higher plants. Plant Physiol. 1977, 59, 309–314. [Google Scholar] [CrossRef]
- Lwalaba, J.L.W.; Zvobgo, G.; Fu, L.; Zhang, X.; Mwamba, T.M.; Muhammad, N.; Mundende, R.P.M.; Zhang, G. Alleviating effects of calcium on cobalt toxicity in two barley genotypes differing in cobalt tolerance. Ecotoxicol. Environ. Saf. 2017, 139, 488–495. [Google Scholar] [CrossRef]
- Heath, R.L.; Packer, L. Photoperoxidation in isolated chloroplasts: I. Kinetics and stoichiometry of fatty acid peroxidation. Arch. Biochem. Biophys. 1968, 125, 189–198. [Google Scholar] [CrossRef]
- Alfatih, A.; Wu, J.; Jan, S.U.; Zhang, Z.S.; Xia, J.Q.; Xiang, C.B. Loss of rice PARAQUAT TOLERANCE 3 confers enhanced resistance to abiotic stresses and increases grain yield in field. Plant Cell Environ. 2020, 43, 2743–2754. [Google Scholar] [CrossRef]
- Livak, K.J.; Schmittgen, T.D. Analysis of relative gene expression data using real-time quantitative PCR and the 2−ΔΔCT method. Methods 2001, 25, 402–408. [Google Scholar] [CrossRef] [PubMed]
- Azhar, N.; Su, N.; Shabala, L.; Shabala, S. Exogenously applied 24-epibrassinolide (EBL) ameliorates detrimental effects of salinity by reducing K+ efflux via depolarization-activated K+ channels. Plant Cell Physiol. 2017, 58, 802–810. [Google Scholar] [CrossRef] [PubMed] [Green Version]


Publisher’s Note: MDPI stays neutral with regard to jurisdictional claims in published maps and institutional affiliations. |
© 2022 by the authors. Licensee MDPI, Basel, Switzerland. This article is an open access article distributed under the terms and conditions of the Creative Commons Attribution (CC BY) license (https://creativecommons.org/licenses/by/4.0/).
Share and Cite
Alam, M.S.; Kong, J.; Tao, R.; Ahmed, T.; Alamin, M.; Alotaibi, S.S.; Abdelsalam, N.R.; Xu, J.-H. CRISPR/Cas9 Mediated Knockout of the OsbHLH024 Transcription Factor Improves Salt Stress Resistance in Rice (Oryza sativa L.). Plants 2022, 11, 1184. https://doi.org/10.3390/plants11091184
Alam MS, Kong J, Tao R, Ahmed T, Alamin M, Alotaibi SS, Abdelsalam NR, Xu J-H. CRISPR/Cas9 Mediated Knockout of the OsbHLH024 Transcription Factor Improves Salt Stress Resistance in Rice (Oryza sativa L.). Plants. 2022; 11(9):1184. https://doi.org/10.3390/plants11091184
Chicago/Turabian StyleAlam, Mohammad Shah, Jiarui Kong, Ruofu Tao, Temoor Ahmed, Md. Alamin, Saqer S. Alotaibi, Nader R. Abdelsalam, and Jian-Hong Xu. 2022. "CRISPR/Cas9 Mediated Knockout of the OsbHLH024 Transcription Factor Improves Salt Stress Resistance in Rice (Oryza sativa L.)" Plants 11, no. 9: 1184. https://doi.org/10.3390/plants11091184