
Abstract
When designing a study for causal mediation analysis, it is crucial to conduct a power analysis to determine the sample size required to detect the causal mediation effects with sufficient power. However, the development of power analysis methods for causal mediation analysis has lagged far behind. To fill the knowledge gap, I proposed a simulation-based method and an easy-to-use web application (https://xuqin.shinyapps.io/CausalMediationPowerAnalysis/) for power and sample size calculations for regression-based causal mediation analysis. By repeatedly drawing samples of a specific size from a population predefined with hypothesized models and parameter values, the method calculates the power to detect a causal mediation effect based on the proportion of the replications with a significant test result. The Monte Carlo confidence interval method is used for testing so that the sampling distributions of causal effect estimates are allowed to be asymmetric, and the power analysis runs faster than if the bootstrapping method is adopted. This also guarantees that the proposed power analysis tool is compatible with the widely used R package for causal mediation analysis, mediation, which is built upon the same estimation and inference method. In addition, users can determine the sample size required for achieving sufficient power based on power values calculated from a range of sample sizes. The method is applicable to a randomized or nonrandomized treatment, a mediator, and an outcome that can be either binary or continuous. I also provided sample size suggestions under various scenarios and a detailed guideline of app implementation to facilitate study designs.
Introduction
Mediation analyses are widely employed for investigating the mediation mechanism through which a treatment achieves its effect on an outcome. In the basic mediation framework, as shown in Fig. 1, a treatment affects a focal mediator, which in turn affects an outcome. For example, a researcher aims to evaluate the impact of a growth mindset by randomly assigning students to an intervention group that conceptualizes intelligence as malleable and a control group that only focuses on brain functions while not emphasizing intelligence beliefs. In theory, the treatment T may enhance students’ challenge-seeking behaviors M, which may subsequently promote their academic outcomes Y. Hence, the researcher plans to further examine the hypothesized mechanism by decomposing the total treatment effect into an indirect effect transmitted through challenge-seeking behaviors and a direct effect that works through other mechanisms.
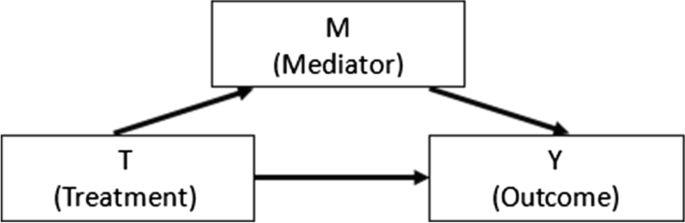
Diagram of a causal mediation process
Path analysis and structural equation modeling (SEM) (e.g., Baron & Kenny, 1986) that rely on a regression of the mediator on the treatment, and a regression of the outcome on the treatment and the mediator, have been adopted as primary approaches for mediation analysis. However, they usually overlook a possible treatment-by-mediator interaction. For example, challenge-seeking behaviors may generate a higher impact on academic outcomes under the growth mindset intervention condition than under the control condition. Ignoring the interaction would lead to biased indirect and direct effect estimates. Besides, they pay little attention to confounders of the treatment–mediator, treatment–outcome, and mediator–outcome relationships. Although the first two relationships are unconfounded when the treatment is randomized, the third one is usually confounded because mediator values are often nonrandomized. For instance, a student who had a higher grade point average (GPA) before the treatment may be more likely to seek challenges and have higher academic achievement in the long run. Therefore, baseline GPA may confound the relationship between challenge-seeking behaviors and academic outcomes. Omitting a confounder from the analysis would bias the indirect and direct effect estimates.
To overcome the above limitations, various mediation analysis methods have been developed under the potential outcomes causal framework (Neyman & Iwaszkiewicz, 1935; Rubin, 1978) in the past decade. The regression-based methods (e.g., Imai et al., 2010a; VanderWeele & Vansteelandt, 2009) extend the traditional SEM framework by further including the treatment-by-mediator interaction in the outcome model and controlling for confounders in both the mediator model and the outcome model. While the regression-based methods rely on correct model specifications, other methods were developed to relax functional assumptions. The weighting-based method (e.g., Hong et al., 2015) estimates the indirect and direct effects through weighted mean contrasts of the outcome without relying on an outcome model, while the weight is constructed based on a mediator model. In contrast, the imputation-based method estimates the indirect and direct effects through mean contrasts of potential outcomes that are imputed only based on an outcome model while not relying on a mediator model (e.g., Vansteelandt et al., 2012). Although the weighting- and imputation-based methods are less vulnerable to model misspecifications, they are less efficient than the regression-based methods. Multiply robust methods that combine the weighting-based and the imputation- or regression-based methods were developed to combine their strengths (e.g., Tchetgen & Shpitser, 2012; Vansteelandt et al., 2012). A detailed review can be found in Qin and Yang (2022).
A natural question that a researcher would raise when designing a study for investigating mediation mechanisms is, “How many observations should I collect to achieve an adequate power for detecting an indirect effect and/or a direct effect based on my chosen mediation analysis method?” Power analysis is an important step of study design for determining the sample size required to detect effects with sufficient power, which is the probability of rejecting a false null hypothesis. Almost all the existing power analysis strategies for mediation analysis have been developed based on the traditional SEM framework ignoring the treatment-by-mediator interaction and confounding bias. While a few derived power formulas (e.g., Vittinghoff et al., 2009), most were developed based on Monte Carlo simulations that repeatedly draw samples of a specific size from a defined population and calculate power as the proportion of the replications with a significant result (e.g., Fossum & Montoya, 2023; Fritz & MacKinnon, 2007; Muthén & Muthén, 2002; Schoemann et al., 2017; Thoemmes et al., 2010; Zhang, 2014). The simulation-based approach is more widely used because it is intuitive and flexible and may be the only viable method when models are complex (VanderWeele, 2020) or the normality assumptions of data and effect estimates are violated (Zhang, 2014).
Nevertheless, power analysis for causal mediation analysis remains underdeveloped. To the best of my knowledge, Rudolph et al. (2020) is the only study that assessed the power of single-level causal mediation analysis methods. They compared through simulations the power of regression-based estimation, weighting-based estimation, and targeted maximum likelihood estimation, which is a doubly robust maximum-likelihood-based approach. While they introduced a simulation-based procedure for power calculation, they did not develop statistical software for easy implementations, nor did they offer a way to calculate the sample size for achieving a given power, which is essential for study design. In addition, they focused on a binary mediator and a binary outcome while not considering other common scales. Moreover, they fitted linear probability models to binary mediator and outcome, which is problematic when covariates are continuous (Aldrich & Nelson, 1984).
VanderWeele (2020) suggested that it is urgent to develop easy-to-use power analysis tools for causal mediation analysis. To fill the knowledge gap, I developed a simulation-based power analysis method and a user-friendly web application for sample size and power calculations for a causal mediation analysis with a randomized or nonrandomized treatment, a mediator, and an outcome that can be either binary or continuous. I also provided tables of sample sizes needed to achieve a power of 0.8 (which is conventionally considered adequate [Cohen, 1990]) for detecting indirect and direct effects under various scenarios, which can be used as guidelines for causal mediation analysis study designs. Different causal mediation analysis methods vary in the degree of reliance on correct model specifications and thus have different power values under different scenarios. Given that regression-based methods are most commonly used in real applications (Vo et al., 2020), I focused on developing a power analysis tool for the regression-based methods that adjust for the treatment-by-mediator interaction and confounders. In addition, I used the Monte Carlo confidence interval method for testing, because it allows the sampling distributions of causal effect estimates to be asymmetric and is less computationally intensive than the bootstrapping method. Because the regression-based methods are more efficient than the weighting- and imputation-based methods, larger sample sizes are expected for the weighting- or imputation-based method to achieve an adequate power than the regression-based methods if the mediator and outcome models are correctly specified.
This article is organized as follows. I first briefly introduce the definition and identification of mediation effects under the counterfactual causal framework, considering both binary and continuous mediator and outcome. I then introduce the estimation and inference method that the proposed power analysis tool relies on. After delineating the simulation-based power analysis procedure, I provide guidelines for researchers to determine how many observations need to be collected for achieving adequate power under various scenarios. I then illustrate the use of the web application for implementing the proposed approach. Finally, I discuss the strengths and limitations of the method, as well as future directions.
Causal framework of mediation analysis
Under the counterfactual causal framework, which is also known as the potential outcomes framework, we can define the causal mediation effects for each individual by contrasting their potential outcomes without relying on a particular statistical model. In the growth mindset example introduced earlier, individual i’s treatment T = 1 if assigned to the growth mindset intervention group and T = 0 if assigned to the control group. The individual has two potential mediators, i.e., potential challenge-seeking behaviors. One is under the growth mindset intervention condition, Mi(1), and the other is under the control condition, Mi(0). Similarly, the individual has two potential outcomes, i.e., potential academic outcomes, Yi(1) and Yi(0). Mi(t) and Yi(t) are observed only if the individual was assigned to T = t, where t = 0, 1. In the mediation framework, as represented by Fig. 1, Y is affected by both T and M. Under the composition assumption, the potential outcome Yi(t) can be alternatively expressed as a function of the treatment and the potential mediator under the same treatment condition, i.e., Yi(t, Mi(t)) (VanderWeele & Vansteelandt, 2009). The definitions of the potential mediator and potential outcome rely on the stable unit treatment value assumption (SUTVA) (Rubin, 1980, 1986, 1990): (1) only one version of each treatment condition, (2) no interference among individuals, and (3) consistency. The consistency assumption is that, among the individuals whose T = t, the observed mediator takes the value of M(t), and among the individuals whose T = t and M = m, the observed outcome takes the value of Y(t, m) (VanderWeele & Vansteelandt, 2009).
A contrast of the potential outcomes under the two treatment conditions defines the total treatment effect for individual i, TEi = Yi(1, Mi(1)) − Yi(0, Mi(0)). To further decompose the total effect into an indirect effect and a direct effect, we need to introduce two additional potential outcomes that are never observable: Yi(1, Mi(0)), individual i’s potential academic outcome if the treatment is at the growth mindset intervention condition while his or her potential challenge-seeking behaviors take the value that would be observed under the control condition, and its opposite Yi(0, Mi(1)). Hence, the total treatment effect can be decomposed into the sum of the total indirect effect TIEi = Yi(1, Mi(1)) − Yi(1, Mi(0)) Footnote 1 and the pure direct effect PDEi = Yi(1, Mi(0)) − Yi(0, Mi(0)), or the sum of the pure indirect effect PIEi = Yi(0, Mi(1)) − Yi(0, Mi(0)) and the total direct effect TDEi = Yi(1, Mi(1)) − Yi(0, Mi(1)) (Robins & Greenland, 1992). TIE and PDE were respectively called as natural indirect effect and natural direct effect by Pearl (2001). I used the terms TIE and PDE here to better contrast with TDE and PIE. The two decompositions are equivalent if the treatment does not affect the mediator when affecting the outcome. A discrepancy between TIEi and PIEi, or equivalently a discrepancy between TDEi and PDEi, indicates a natural treatment-by-mediator interaction effect, INTi = TIEi − PIEi = TDEi − PDEi.
If the treatment T has more than two categories or is continuous, 1 and 0 in the above definitions can be replaced with any two different values of T, t and t′ (Imai et al., 2010a; VanderWeele & Vansteelandt, 2009). By taking an average of each effect over all the individuals, we can define the population average effects as listed in Table 1. The whole set of TIE, PDE, PIE, TDE, and INT is referred to as causal mediation effects throughout this article, because the mediation mechanism is revealed by all these effects as a whole.
Even though all the potential outcomes can be defined for all the individuals, Yi(t, Mi(t)) (or Yi(t′, Mi(t′))) is observed only for those who received treatment level t (or t′), while Yi(t, Mi(t′)) (or Yi(t′, Mi(t))) is never observable given that t ≠ t′. Nevertheless, we can still identify the population average causal effects as defined in Table 1, by relating the unobserved quantities to observed data, which requires the following assumptions (e.g., Imai et al., 2010a; VanderWeele & Vansteelandt, 2009):
-
1.
No unmeasured pretreatment confounders of the treatment–mediator relationship
-
2.
No unmeasured pretreatment confounders of the treatment–outcome relationship
-
3.
No unmeasured pretreatment confounders of the mediator–outcome relationship
-
4.
No posttreatment confounders of the mediator–outcome relationship
Here, pretreatment confounders refer to the confounders preceding the treatment, while posttreatment confounders refer to the confounders affected by the treatment. Unlike Assumptions 3 and 4, Assumptions 1 and 2 always hold if treatment is randomized.
Identification of causal effects
As reviewed in the introduction, various causal mediation analysis methods have been proposed to identify and estimate the effects under the above identification assumptions. This study is focused on the regression-based methods (Imai et al., 2010a; VanderWeele & Vansteelandt, 2009) that extend the SEM framework by adjusting for the treatment-by-mediator interaction and pretreatment confounders, as they are most commonly used and are most efficient when the mediator and outcome models are correctly specified. In this section, I briefly introduce the regression-based identification results of , PDE, PIE, TDE, and INT for a treatment that can be of any scale when both the mediator and outcome are continuous or binary, or when one of them is continuous and the other is binary. Proofs can be found in Appendix A.
Continuous mediator and continuous outcome
If both the mediator and outcome are continuous, their models can be written as:
where Xi indicates a vector of individual i's pretreatment covariates; \({\beta}_t^m,{\beta}_m^y\), and \({\beta}_t^y\) respectively represent the paths T➔ M, M➔ Y, and T➔ Y in Fig. 1, and \({\beta}_{tm}^y\) represents TM➔ Y (i.e., moderation of M➔ Y by T). Based on Eq. 1, the causal mediation effects are identified as follows:
where t and t′ are two different treatment levels to be contrasted. If the treatment is binary with t = 1 and t′ = 0, PIE is always \({\beta}_m^y{\beta}_t^m\), which is equivalent to the indirect effect defined in the traditional mediation analysis, regardless of the treatment-by-mediator interaction. If there is no treatment-by-mediator interaction, and t and t′ are one unit apart, \(TIE= PIE={\beta}_m^y{\beta}_t^m\), which is also the same as the indirect effect defined in the traditional mediation analysis.
Continuous mediator and binary outcome
When the outcome is binary, VanderWeele and Vansteelandt (2010) redefined the causal mediation effects on the odds ratio scale. However, they can estimate these effects only when the outcome is rare. In contrast, Imai et al. (2010a) identified the causal mediation effects without changing their definitions, and the identification results are applicable to both rare and non-rare outcomes. Hence, I adopt the latter in this study.
When the mediator is continuous and the outcome is binary, the mediator model stays the same as in Eq. 1, while a latent regression is fitted for the outcome instead.
where \({Y}_i^{\ast }\) is a latent index of Yi. \({Y}_i=\textbf{1}\left({Y}_i^{\ast }>0\right)\) indicates that Yi takes the value of 1 if \({Y}_i^{\ast }>0\) and 0 otherwise. \({\varepsilon}_{y_i^{\ast }}\) follows a logistic distribution if a logistic regression is fitted for the outcome, and it follows a standard normal distribution if a probit regression is fitted instead. Extending the illustration in Imai et al. (2010a), I further account for the treatment-by-mediator interaction and pretreatment covariates above. Based on Eq. 2, we can identify that
which can be computed with a numerical integration method. Because the computation takes more time if \({\varepsilon}_{y_i^{\ast }}\) follows a logistic distribution, I opt for a probit regression in this study. Hence, \({\varepsilon}_{y_i^{\ast }}\sim N\left(0,1\right)\). If \({\varepsilon}_{mi}\sim N\left(0,{\sigma}_m^2\right)\), the above identification result can be further written as
where Φ represents the cumulative density function of the standard normal distribution. The same applies to the identifications of E[Yi(t′, Mi(t))], E[Yi(t, Mi(t))], and E[Yi(t′, Mi(t′))]. We are then able to identify each causal effect by taking a contrast of expected potential outcomes.
Binary mediator and continuous outcome
If the mediator is binary and the outcome is continuous, I replace the mediator model with a probit regression and use the same outcome model as in Eq. 1:
based on which the causal mediation effects are identified as:
Binary mediator and binary outcome
For a binary mediator and a binary outcome, I fit probit regressions for both:
based on which we can identify that
Similarly, we can identify [Yi(t′, Mi(t))], E[Yi(t, Mi(t))], and E[Yi(t′, Mi(t′))]. Each causal effect can be identified via a contrast of expected potential outcomes.
Estimation and inference of causal effects
Given that all the causal mediation effects are identified as functions of mediator and outcome model coefficients, they can be estimated and tested with the same methods for the traditional mediation analysis as reviewed by MacKinnon et al. (2004). In the regression-based causal mediation analysis, the most commonly adopted estimation methods include the traditional Z-test method, which relies on the delta method-based standard errors of the effect estimates, bootstrapping method (VanderWeele & Vansteelandt, 2009), and quasi-Bayesian Monte Carlo method (Imai et al., 2010a), which is adopted by the R package mediation (Tingley et al., 2014) and is widely known as the Monte Carlo confidence interval method. The Z-test method is not recommended because it relies on the normality assumption of the effect estimates, which is violated if the estimates involve products of regression coefficient estimates (MacKinnon et al., 2004). In this study, I use the Monte Carlo confidence interval method instead of the bootstrapping method mainly because the former is less computationally intensive (Preacher & Selig, 2012).
Monte Carlo confidence interval method
The Monte Carlo confidence interval method takes the following steps:
-
1.
Fit the mediator and outcome models.
-
2.
Simulate Q (e.g., 1000) sets of mediator and outcome model coefficients β’s from their multivariate sampling distribution, which approximates a multivariate normal distribution with the point estimates of β’s as the mean and their covariance matrix as the variance. It is worth noting that, under the central limit theorem, the distribution of the regression coefficient estimates is normal at a sufficient sample size even if the response variable of the regression does not follow a normal distribution (King et al., 2000, page 349).
-
3.
Based on each set of simulated β’s obtained from Step 2, estimate the causal mediation effects as identified above.
-
4.
Calculate the final point estimate and confidence interval of each causal effect by calculating the mean and percentiles of the Q effect estimates obtained from Step 3.
The above algorithm is equivalent to Algorithm 1 in Imai et al. (2010a). While I first identified each causal effect through a mean contrast of potential outcomes as a function of regression coefficients β’s and then estimated them directly based on random draws of β’s, Imai et al. (2010a) first simulated the potential outcomes based on random draws of β’s for each individual, and then calculated each causal effect as a mean contrast of simulated potential outcomes over all the individuals. When the outcome is binary, the two approaches are exactly the same. When the outcome is continuous, the algorithm described above involves less computation and thus runs faster.
The Monte Carlo confidence interval method (shortened as the Monte Carlo CI method below) shares the advantage of the bootstrapping method in that it can accommodate the asymmetry of sampling distributions of the causal mediation effect estimates. It has been argued that the bootstrapping method may be preferable in the presence of a continuous mediator or outcome that is nonnormal. The Monte Carlo CI method relies on the multivariate normality assumption of the mediator and outcome model coefficient estimates, which may be violated if the sample size is small and the mediator or the outcome is nonnormal. However, Appendix C shows that the two methods are in fact comparable by assessing through simulations the performance of the Monte Carlo CI method and the bootstrapping method under various scenarios that vary by the sample size (30, 50, and 150), the skewness and kurtosis (1 & 1; 2 & 3; 3 & 8)Footnote 2 of the distributions of the mediator and the outcome, and the model parameter values (all 0s, and the smallest and largest sets of parameter values considered in the section of sample size planning). The two methods have very similar performance in terms of bias, mean squared error (MSE), 95% confidence interval coverage rate, type I error rate, and power of PIE, TIE, PDE, TDE, and INT across all the scenarios. Under the considered scenarios, the bias of all the effect estimates is almost always ignorable. Only when the true effects are close to 0, the sample size is 30, and the skewness is 3, the relative bias of the INT estimate generated by the bootstrapping method is respectively as large as −19.59%, while that under the Monte Carlo CI method is only −3.01%. The 95% confidence interval coverage rates of PDE and TDE are always very close to 95%, and those of PIE, TIE, and INT approximate 95% as the true effect and sample size increase, no matter if the Monte Carlo CI method or the bootstrapping method is used. Therefore, both methods are suitable in nonnormal cases. Unlike the bootstrapping method, which fits mediator and outcome models for each bootstrapped sample, the Monte Carlo CI method fits the models only once and thus greatly saves running time in the proposed simulation-based power analysis. Therefore, this study adopts the Monte Carlo CI method for the estimation and inference of the causal mediation effects.
Simulation-based approach for power analysis for causal mediation analysis
The proposed power analysis method is based on Monte Carlo simulations. The idea is to mimic the sampling process by repeatedly drawing samples of a given size from a population predefined with hypothesized models and parameter values. After applying the chosen analysis and inference methods to each replication, we can then calculate power based on the proportion of the replications with a significant result. Based on power values calculated from a range of sample sizes, we can draw a power curve and determine when a sufficient power can be achieved. Specifically, the simulation-based power analysis takes the following steps.
Step 1. Data generation
First, population models are specified. The models can be chosen among Eqs. 1–4, depending on the scales of the mediator and outcome. If T is not randomized, an additional treatment model needs to be specified for the generation of T, although it is not required in the estimation and inference of the causal mediation effects. If T is continuous, its model is specified as
If T is binary, a probit model is specified instead:
Next, parameter values of the standardizedFootnote 3 population models are specified. By standardizing the population models, we can achieve power analysis results independent of measurement scales. A standardized model standardizes each of the dependent variables and the independent variables to have a mean of 0 and a variance of 1. If the dependent variable is binary, its latent index is standardized instead (Grace et al., 2018). Hence, the intercepts of the standardized models, \({\beta}_0^m\) and \({\beta}_0^y\), are always 0. \({\beta}_t^m\), \({\beta}_m^y\), \({\beta}_t^y\), and \({\beta}_{tm}^y\) can be specified based on empirical knowledge or expectation about the paths T➔ M (or M∗ if M is binary), M➔ Y, T➔ Y, and TM➔ Y (or Y∗ if Y is binary). Because X consists of a collection of pretreatment covariates, it is difficult for users to specify the coefficient of one covariate after another. Nevertheless, it is straightforward to specify the proportion of the variance in T (or T∗ if T is binary) explained by XFootnote 4, \({R}_{tx}^2\), the proportion of the variance in M (or M∗ if M is binary) explained by X, \({R}_{mx}^2\), and the proportion of the variance in Y (or Y∗ if Y is binary) explained by X, \({R}_{yx}^2\). These R2’s are the proportions of the variances explained by X without controlling for any variables. They are easier to specify than partial R2’s that control for the other variables in the models because they are commonly documented in the design literature, and applied researchers tend to have a better sense of their magnitudes.
Finally, variables are generated at a given sample size as follows.
-
Generation of X. Some power analysis methods use a single covariate as a composite indicator of multiple covariates in a model because they are similar in spirit (e.g., Kelcey et al., 2017a, 2017b; Raudenbush, 1997), but they are not exactly the same because more degrees of freedom will be lost if multiple covariates are used. The difference is negligible when the sample size is larger than the number of covariates to a certain extent. For example, with a focus on treatment effect estimation, Bloom (2008) found that, “with roughly 40 or more sample members and 10 or fewer covariates, this difference is negligible.” However, the difference is non-negligible when the sample size is relatively small, as illustrated later in the simulation section. Therefore, I first focus on a single standard normal covariate X and derive its coefficients in the standardized treatment, mediator, and outcome models based on \({R}_{tx}^2\), \({R}_{mx}^2\), and \({R}_{yx}^2\), and the other model parameters. Given the number of covariates p, I generate p independent standard normal covariates and assume that they evenly partition each of \({R}_{tx}^2\), \({R}_{mx}^2\), and \({R}_{yx}^2\)Footnote 5, so that the coefficient of each covariate in each model can be calculated as the previously derived coefficient of the single covariate divided by \(\sqrt{p}\). More details can be found in Appendix B.
-
Generation of T. If the treatment T is randomized and binary, it is generated from a Bernoulli distribution B(1, p), where p is the probability of T = 1. If T is randomized and continuous, we allow it to be nonnormal with a mean of 0, a variance of 1, and any skewness and kurtosis specified by a user. The skewness and kurtosis follow the theoretical relationship that kurtosis ≥ skewness2 − 2 (Qu et al., 2020). T is normal if both the skewness and kurtosis are 0. It is generated using the method developed by Fleishman (1978), which can be realized in the R package mnonr (Qu & Zhang, 2020).Footnote 6 If T is nonrandomized and binary, a latent treatment \({T}_i^{\ast }\) is generated based on the standardized treatment model in Eq. 6, where \({\varepsilon}_{t_i^{\ast }}\) is generated from \(N\left(0,1-{\beta}_x^{t2}\right)\). T takes the value of 1 if \({T}_i^{\ast }>0\), and 0 otherwise. If T is nonrandomized and continuous, it is generated based on the standardized treatment model in Eq. 5, where εti is generated with a mean of 0, a variance of \({\sigma}_t^2=1-\textrm{Var}\left({\beta}_x^tX\right)=1-{\beta}_x^{t2}\), and specified skewness and kurtosis.
-
Generation of M. A continuous mediator M is generated based on the standardized mediator model in Eqs. 1 and 2, where εmi is generated with a mean of 0, a variance of \({\sigma}_m^2=1-\textrm{Var}\left({\beta}_t^mT+{\beta}_x^mX\right)\), and specified skewness and kurtosis. The derivation of \({\sigma}_m^2\) differs across different types of T. For simplicity, we can calculate \({\sigma}_m^2\) directly based on simulated T and X. If M is continuous but Y is binary, the identification of the causal effects requires M to be normal, as explicated in the identification section. If M is binary, a latent mediator \({M}_i^{\ast }\) is generated based on the standardized mediator model in Eqs. 3 and 4, where \({\varepsilon}_{m_i^{\ast }}\) is generated from \(N\left(0,1-\textrm{Var}\left({\beta}_t^mT+{\beta}_x^mX\right)\right)\). M takes the value of 1 if \({M}_i^{\ast }>0\), and 0 otherwise.
-
Generation of Y. A continuous outcome Y is generated based on the standardized outcome model in Eqs. 1 and 3, where εyi is generated with a mean of 0, a variance of \({\sigma}_y^2=1-\textrm{Var}\left({\beta}_t^yT+{\beta}_m^yM+{\beta}_{tm}^y TM+{\beta}_x^yX\right),\)and specified skewness and kurtosis. The derivation of \({\sigma}_y^2\) is complex due to the correlations among T, M, and X, and differs across different scenarios. The calculation can be greatly eased with simulated T, M, and X. If Y is binary, a latent outcome \({Y}_i^{\ast }\) is generated based on the standardized outcome model in Eqs. 2 and 4, where \({\varepsilon}_{y_i^{\ast }}\) is generated from \(N\left(0,1-\textrm{Var}\left({\beta}_t^yT+{\beta}_m^yM+{\beta}_{tm}^y TM+{\beta}_x^yX\right)\right)\). Y takes the value of 1 if \({Y}_i^{\ast }>0\) and 0 otherwise.
Step 2. Estimation and inference
We then test the significance of a selected causal mediation effect at a given significance level (e.g., 5%), by applying the Monte Carlo confidence interval method as introduced in the previous section to the sample generated in Step 1. The analytic models for causal mediation analysis are assumed to be the same as the population models for data generation.
Step 3. Power calculation
By repeating Steps 1 and 2 K (e.g., 1000) times, we calculate the power to detect whether the selected causal mediation effect exists as the percentage of replications that test the effect to be significantly different from 0. The larger the number of replications K, the more precise the power calculation will be. Given K, the power calculation result may slightly differ across simulations, due to the uncertainty in the data generation and estimation.
Step 4. Sample size calculation
To determine the sample size that yields a target power (e.g., 0.8), we specify a range of sample sizes with a step size and calculate power at each sample size step following Steps 1–3. This will generate a power curve fitted with a loess line, based on which we can predict the sample size for achieving the target power. If all the power values are smaller than the target power, the maximum sample size needs to be increased. If all the power values are larger than the target power, the minimum sample size needs to be decreased. The sample size calculation is more precise with a smaller step size and a larger number of replications K in Step 3. Depending on how the range of sample sizes, the step size, and K are specified, and due to the uncertainty in the data generation and estimation, users would expect a slight difference in the sample size calculation result across simulations.
The proposed power analysis approach has several advantages. First, it is intuitive because it mimics the sampling process and calculates power as the proportion of samples with a significant result, which exactly matches how power is defined. Second, it is flexible and always applicable no matter how complex the models are. Third, relying on the Monte Carlo confidence interval method for inference, it does not require the effect estimates to be normal. Fourth, it may provide more accurate power than other approaches at a relatively small sample size (Thoemmes et al., 2010). A major concern about simulation-based power analysis methods has been their computational complexity. However, as explained earlier, the running time is greatly reduced with the Monte Carlo confidence interval method implemented for each replication. The specific running time can be found at the end of the web application section.
Sample size planning for causal mediation analysis
To facilitate causal mediation analysis study designs, I provide sample size guidelines for achieving a power of 0.8 for binary or normal mediator and outcome under various scenarios, with a focus on a randomized binary treatment, where the probability of T = 1 is 0.5. Sample size planning for a nonrandomized and/or continuous treatment or nonnormal mediator or outcome is not covered in this section, but can be conducted through the web application introduced in the next section.
I chose parameter values by following Cohen’s (1988) guidelines for R2 (0.02 as small [S] and 0.13 as medium [M]). Similar to Fritz and MacKinnon (2007), I also considered R2 = 0.01, which is halfway between 0 and small (HS), and R2 = 0.075, which is halfway between small and medium (HM). Corresponding to 1%, 2%, 7.5%, and 13% of variance of the response uniquely explained by the predictor, standardized coefficients of 0.1, 0.14, 0.27, and 0.36 respectively represent HS, S, HM, and M effect sizes. To cover a range of plausible scenarios in real applications, I considered S and HM effect sizes (i.e., 0.14 and 0.27) for \({\beta}_t^m\) and \({\beta}_m^y\), S and M effect sizes (i.e., 0.14 and 0.36) for \({\beta}_t^y\), HS and S effect sizes (i.e., 0.1 and 0.14) for \({\beta}_{tm}^y\), and S and HM effect sizes (i.e., 0.02 and 0.075) for \({R}_{mx}^2\) and \({R}_{yx}^2\). For each scale set of mediator and outcome, this leads to 26 = 64 different scenarios in total, under which the true value range of each causal mediation effect is listed in Table 2. This appropriately reflects the findings from meta-analyses of mediation that the effect sizes of indirect effects are usually small (Montoya, 2022, pages 16–17), and the empirical findings from the increasing literature of causal mediation analysis that the treatment-by-mediator interaction effect may be smaller (e.g., Qin et al., 2021a, b). The selected parameter values cover common scenarios. The web application can be easily implemented for any other scenarios that are not considered. Here I assume β’s to be positive, while they can be negative in reality, and different signs of β’s may lead to different values of power. In the cases with negative β’s, I suggest running the web application rather than relying on the sample size suggestions in this section.
By applying the proposed power analysis method, I calculated the sample size required to detect each causal mediation effect with power of 0.8 under each of the above scenarios. Both the number of simulations of mediator and outcome model coefficients in each simulated data set, Q, and the number of simulated data sets, K, were specified as 1000, and the significance level was set at 0.05. Tables 3, 4, 5 and 6 respectively list the results for a normal mediator and a normal outcome, for a normal mediator and a binary outcome, for a binary mediator and a normal outcome, and for a binary mediator and a binary outcome, when the number of covariates is 1. For example, when all the parameters are small and both the mediator and outcome are normal, approximately 371 observations are required to achieve a power of 0.8 for detecting a total indirect effect at the significance level of 0.05; when both \({R}_{mx}^2\) and \({R}_{yx}^2\) are increased to HM, the required sample size is reduced to 355; when \({\beta}_t^m\) and \({\beta}_m^y\) are further increased to HM, and \({\beta}_t^y\) is further increased to the medium level, only 107 observations are needed.
When the number of covariates is increased to 10, the sample sizes required for detecting each effect with power of 0.8 can be found in Appendix Tables 13, 14, 15 and 16. The relative change in the required sample size due to the increase in the number of covariates is non-negligible under a scenario that requires a small sample size for detecting an effect. For example, when \({\beta}_t^y\) is M, \({\beta}_m^y\) is S, \({\beta}_{tm}^y\) is HS, \({R}_{mx}^2\) and \({R}_{yx}^2\) are S, \({\beta}_t^m\) is HM, and both the mediator and outcome are normal, the sample size required for detecting TDE with power of 0.8 increases by 22% (from 54 to 66) if the number of covariates is increased from 1 to 10. In contrast, the sample size required for detecting PIE with power of 0.8 under the same scenario only changes by 5% (from 661 to 697). While the latter is mainly due to the uncertainty of simulations, the number of covariates plays a nontrivial role in the former.Footnote 7 This validates my argument in the subsection on the generation of X that it is important to consider the number of covariates in the power analysis when the sample size is relatively small.
As shown in the tables, under each scenario, the sample size required for detecting a causal mediation effect with power of 0.8 is different from one effect to another. The determination of the planned sample size depends on the focal research interest. For example, when all the parameters are small, researchers need to collect at least 371 observations if their focal interest is in detecting a total indirect effect, and collect at least 767 observations (i.e., the largest required sample size of all) if they want to detect all the causal mediation effects. If the focal interest is in the indirect effect but it is hard to tell whether the total indirect effect or the pure indirect effect is of more interest, researchers can compare the required sample sizes for detecting the two effects and choose the larger one as the planned sample size.
It is assumed in the above sample size planning that the continuous mediator and outcome are normal. A combination of Table 3 and Appendix Tables 8, 9, 10, 11 and 12 indicate that a larger sample size is required for achieving a target power in the presence of continuous mediator and outcome that are nonnormal.
Web application for power analysis for causal mediation analysis
The sample size guidelines in the previous section only covers a limited number of scenarios. To enable researchers to implement the proposed power analysis method under other scenarios, I developed a web application, which can be accessed from https://xuqin.shinyapps.io/CausalMediationPowerAnalysis/. The app is applicable to binary or continuous treatment, mediator, and outcome, and allows the treatment to be nonrandomized. It can calculate power at a given sample size or calculate sample size at a given power. It can also generate a power analysis curve. It is worth noting that the app is built upon the regression-based causal mediation analysis with the Monte Carlo confidence interval method for estimation and inference. Although it is not applicable to other causal mediation analysis methods, it may provide researchers with a rough sense of the minimum sample size required for detecting a causal mediation effect at a given power or the maximum power at a given sample size, because the chosen method is the most efficient when models are correctly specified. To implement the app, a user needs to specify the objective of power analysis, types of variables, population model parameters, and other parameters for power analysis on the left panel, as follows.
Objective
Users should first select the objective of the power analysis between two options. If “Calculate power at a target sample size” is selected, users need to specify “Target sample size”, which must be an integer larger than 5. If “Calculate sample size at a target power” is selected, users need to specify “Target power”, which must be between 0 and 1. Users are then required to select the focal causal effect via “Causal effect”, which has five options, “Total Indirect Effect (Natural Indirect Effect)”, “Pure Direct Effect (Natural Direct Effect)”, “Pure Indirect Effect”, “Total Direct Effect”, and “Natural Treatment-by-Mediator Interaction Effect”, as defined in Table 1. As explicated in the previous section, the selection of the effect depends on focal research interest. If multiple effects are of interest when the target is to calculate sample size at a target power, users can calculate the sample size required for detecting each effect at the target power separately and choose the largest sample size.
Variable specification
The scales of the treatment T, mediator M, and outcome Y can be selected between “Binary” and “Continuous”. If the treatment is binary, users must specify “The probability of T = 1”, which should be between 0 and 1; the two treatment levels to be contrasted are 1 and 0 (i.e., t = 1 and t′ = 0) by default, and users do not need to specify them. If the treatment is continuous, “Treatment level of standardized T” and “Control level of standardized T” must be specified. Users should also select if the treatment is randomized via “Randomization of treatment”.
Model parameter specification
Standardized mediator and outcome modelsFootnote 8 are displayed on the right panel based on the variable specifications. If the treatment/mediator/outcome is binary, the corresponding model is a probit model. These models serve both as population models for data generation and as analytic models for causal mediation analysis. If the treatment is not randomized, a standardized treatment model is also displayed, but for data generation only. Users are required to specify the parameter values for the displayed models. If the model parameter value specifications lead to a negative variance of the error term in the mediator or outcome model, an error message will be generated. Users may specify \({\beta}_t^m\), \({\beta}_t^y\), \({\beta}_m^y\), \({\beta}_{tm}^y\), \({R}_{tx}^2\), \({R}_{mx}^2\), and \({R}_{yx}^2\) respectively based on empirical knowledge or expectations about the paths T➔ M (or M∗ if M is binary), T➔ Y, M➔ Y, TM➔ Y (or Y∗ if Y is binary), the proportion of the variance in T (or T∗ if T is binary) explained by X, the proportion of the variance in M (or M∗ if M is binary) explained by X, and the proportion of the variance in Y (or Y∗ if Y is binary) explained by X. \({R}_{mx}^2\) and \({R}_{yx}^2\) must be between 0 and 1. Even though the treatment-by-mediator interaction is often not involved in traditional mediation analysis, researchers may gain empirical knowledge about \({\beta}_{tm}^y\) by including the treatment-by-mediator interaction in a pilot study or a reanalysis of data from previous studies. For example, the standardized treatment-by-mediator interaction effect on the outcome is estimated as −0.19 in the National Evaluation of Welfare-to-Work Strategies (NEWWS) data that Hong et al. (2015) analyzed. Users can also specify the number of covariates. As discussed earlier, the influence of the number of covariates on power is nontrivial when the sample size is relatively small.
If the nonrandomized treatment/mediator/outcome is continuous, the error term of the corresponding model can be either normal or nonnormal. Users are allowed to specify the skewness and kurtosis of the distribution of the error term following the theoretical relationship that kurtosis ≥ skewness2 − 2 (Qu et al., 2020). If this rule is disobeyed, an error message will be generated that “Kurtosis must be no less than squared skewness minus 2”. If the treatment is continuous and randomized, users will specify the skewness and kurtosis of the distribution of the treatment instead. Both the skewness and kurtosis are 0 if the distribution is normal. If the mediator is continuous and the outcome is binary, the web app forces the error term of the mediator model to be normal, as explained in the identification section. A further discussion of parameter value specifications can be found in the discussion section.
Given the hypothesized model parameter values, the hypothesized value of the selected effect is displayed below the models on the right panel. In the calculation of the hypothesized effect, continuous T, M, and/or Y are standardized, and binary T, M, and/or Y are on the original scale. For example, if T, M, and Y are all continuous, and “Treatment level of standardized T” and “Control level of standardized T” are respectively set as 1 and 0, the displayed hypothesized value of PIE indicates the average change in the standardized outcome if the treatment is fixed at 0, while the standardized mediator is changed from the level that would be observed when the treatment is 0 to that when the treatment is one standard deviation above the mean. If T is binary instead, the hypothesized PIE indicates the average change in the standardized outcome if the treatment is held at 0, while the standardized mediator is changed from the level that would be observed when the treatment is 0 to that when the treatment is 1.
Power analysis specification
In addition to the model parameters, users are also required to specify “Significance level” (must be between 0 and 1), “Minimum sample size” (must be an integer larger than 5), “Maximum sample size” (must be an integer larger than the minimum sample size), “Sample size step” (must be a positive integer), “Number of replications per sample size for power calculation” (i.e., K must be an integer larger than 5), “Number of Monte Carlo draws per replication for causal mediation analysis” (i.e., Q must be an integer larger than 5), and “Random seed” (can be any positive integer). Below, I offer some guidelines when specifying these parameters.
-
(1)
Minimum and maximum sample sizes and sample size step determine the sample sizes considered for the generation of power curve and the calculation of sample size for achieving the target power. For example, if the minimum and maximum sample sizes are 50 and 500, respectively, and the sample size step is 50, power will be calculated at sample sizes of 50, 100, 150, 200, 250, 300, 350, 400, 450, and 500. If the objective is to calculate the sample size but all the power values are smaller than the target power or all the power values are bigger than the target power, a warning message will be generated. The wider the range of the sample size is, and/or the smaller the step size is, the more simulations will be run and thus the longer the computation time will be. Hence, users may (1) initially specify a wide range of sample sizes and a large step size to get a rough sense about the approximate sample size for achieving the target power and 2) then narrow down the range and reduce the step size to increase the smoothness of the power curve and the precision of the sample size estimation. In addition, Tables 3, 4, 5 and 6 and Appendx Tables 13, 14, 15 and 16 may serve as a reference for the specification of the range of sample sizes.
-
(2)
The default number of replications per sample size for power calculation is 1000, which is often used in the literature of simulation-based power analysis (e.g., Thoemmes et al., 2010; Zhang, 2014). To ensure that the number of replications is sufficient, users may increase the number of replications and check if the results are stable. The default number of Monte Carlo draws per replication for causal mediation analysis is 1000, which should be sufficient in most cases but may need to be increased when the sample sizes are small (Imai et al., 2010a). Similar to the specification of the number of replications, users may also try a larger number of Monte Carlo draws and examine the stability of the results.
-
(3)
The random seed is for ensuring the replicability of the results. Because the power analysis is based on randomly generated data, and the causal mediation analysis is based on random draws of model coefficients, the results may be different from one run to another. By allowing users to specify the random seed, the app enables users to replicate the results.
In the default setting, the objective is to calculate the sample size at a target power of 0.8 for detecting a total indirect effect when the treatment is a randomized binary variable that takes the value 1 with probability of 0.5 and both the mediator and outcome are normally distributed. The standardized mediator and outcome model coefficients, \({R}_{mx}^2\) and \({R}_{yx}^2\), all take the value 0.2 except for the coefficient of the treatment-by-mediator interaction, which is specified as 0.05. Such specifications lead to a total indirect effect of 0.1. The number of covariates is specified as 1. The significance level is specified as 5%. The minimum and maximum sample sizes are 50 and 500, respectively, and the sample size step is 50. Both the number of replications per sample size for power calculation and the number of Monte Carlo draws per replication for causal mediation analysis are 1000. The random seed is set at 1. After clicking the “Go” button at the bottom of the left panel, the app begins to run, and a progress bar shows up in the lower right corner. Once the run is completed, the progress bar disappears, and users may go to the top and check results by clicking the up arrow icon in the lower right corner. If the program runs successfully, a power curve and a table will be generated as shown in Fig. 2 and Table 7.

Power curve generated under the default setting
In the power curve, dashed lines are added to mark the target power and the corresponding sample size. The table below lists all the sample sizes used for generating the curve and the corresponding power values. The target power and the corresponding sample size are also included and indicated in bold. For example, Fig. 2 and Table 7 indicate that the sample size needed for detecting a total indirect effect with a power of 0.8 under the default setting is approximately 221. If the objective is to calculate power at a target sample size, dashed lines that mark the target sample size and the corresponding power value will be added to the power curve instead, and the target sample size and the corresponding power value will be included in the table instead. Before a new run, please make sure to click the “Clear” button at the bottom of the output on the right panel.
It takes 49 seconds to run the default setting in which both the mediator and outcome are continuous. If the mediator is continuous and the outcome is binary, or if the mediator is binary and the outcome is continuous, it will take 9 minutes. If both the mediator and outcome are binary, it will take 15 minutes. When either the mediator or the outcome is binary, users may (1) save time by specifying a large sample size range with a large step size and a small number of replications (e.g., 100) in a preliminary assessment and (2) then specify a narrower sample size range with a smaller step size and increase the number of replications in the final run to improve the precision and stability of the results.
Discussion
While the existing literature of power analysis for causal mediation analysis is almost blank, this study filled the knowledge gap by developing a simulation-based power analysis method for regression-based causal mediation analysis, as well as a user-friendly web application. The first step is to define a population with hypothesized models and parameter values, from which samples of a specific size are repeatedly generated. The second step is to fit the hypothesized mediator and outcome models to each sample, and estimate and test a causal mediation effect at a given significance level using the Monte Carlo confidence interval method. The third step is to calculate the power as the percentage of samples with a significant result. Users can also calculate the sample size required for achieving a specific power based on power values calculated from a range of sample sizes. The method is applicable to binary or continuous treatment, mediator, and outcome in randomized or observational studies. It is intuitive, flexible, and easy to implement. In addition, it does not require the causal effect estimates to be normal.
It is worth noting that the proposed power analysis approach is only applicable to regression-based causal mediation analysis with the Monte Carlo confidence interval method for estimation and inference. In other words, if researchers adopt the proposed method for power analysis at the design stage, they should use the regression-based causal mediation analysis method and estimate and test the causal mediation effects with the Monte Carlo confidence interval method at the analysis stage. The analysis can be conducted using the R package mediation. Since the regression-based approach is more efficient than the other causal mediation analysis methods such as the weighting-based or imputation-based method when the mediator and outcome models are correctly specified, the proposed approach may provide users with guidelines on the minimum number of observations they should collect to achieve a specific power or the maximum power they can achieve at a specific sample size. To calculate the exact power or sample size for the other causal mediation analysis methods, researchers may simply extend the proposed power analysis procedure by implementing the other causal mediation analysis methods in Step 2 (estimation and inference).
An important and challenging component of a power analysis is the specification of the parameter values. Some may specify the parameters based on normative criteria or external constraints. Others may use parameter estimates from previous studies or pilot studies. There is no concern about the former, but the latter is criticized due to the uncertainty of the parameter estimates, which could result in underpowered studies (Liu & Wang, 2019), and the problem is particularly severe if the sample sizes of the previous studies or pilot studies are small (Liu & Yamamoto, 2020). Liu and Wang (2019) developed a power analysis method that considers uncertainty in parameter estimates for traditional mediation analysis. They modeled the uncertainty in the parameter estimates via their joint sampling distribution and calculated a power value based on each random draw of parameter estimates from their sampling distribution. Hence, instead of producing one single power value, they provided a power distribution at a specific sample size. The idea can be extended to power analysis for causal mediation analysis.
Several other extensions can be incorporated into the web application in the future.
First, the current study allows treatment, mediator, and outcome to be binary, normal, or nonnormal with nonzero skewness and kurtosis. The proposed procedure can be further extended for applications to categorical data with more than two categories, count data, and survival data.
Second, in this study, the treatment–mediator, treatment–outcome, and mediator–outcome relationships, as well as the relationship between the treatment-by-mediator interaction and the outcome, are assumed to be constant. However, in many applications, the relationships may vary by different individuals or contexts, and it is of interest to investigate the heterogeneity of mediation mechanisms. Hence, a causal moderated mediation analysis is needed. Qin and Wang (2023) developed an R package moderate.mediation for easy implementations of regression-based causal moderated mediation analysis with the Monte Carlo confidence interval method for estimation and inference. A compatible power analysis tool will be further developed by incorporating moderators in the population models in Step 1 (data generation) and the analytic models in Step 2 (estimation and inference).
Third, this study assumes no posttreatment confounding of the mediator–outcome relationship. In other words, the relationship between the mediator and outcome is not confounded by any variables that are affected by the treatment. However, such confounders may exist in many real applications. For example, in the growth mindset example, students in the intervention group may engage more with the treatment messages and thus be more motivated for challenge seeking and have a higher GPA. Therefore, treatment engagement is a potential posttreatment confounder of the relationship between challenge-seeking behaviors (mediator) and academic performance (outcome). Some researchers have developed sensitivity analysis strategies to assess the influence of posttreatment confounding (Daniel et al., 2015; Hong et al., 2023). Others have developed causal mediation analysis from the interventional perspective that allows for posttreatment confounding (e.g., VanderWeele et al., 2014). Despite the limitations of Rudolph et al. (2020), as explicated in the introduction section, they considered posttreatment confounding in power analysis for causal mediation analysis from the interventional perspective. However, they focused on binary mediator and outcome and used linear probability models that may be problematic when covariates are continuous. Extensions can be made to the proposed procedure in the current study by updating the population models in Step 1 (data generation) and the analytic models in Step 2 (estimation and inference) under the framework that can accommodate posttreatment confounders.
Fourth, power analysis for mediation analysis in multilevel designs has not been discussed until recently. Kelcey et al. (2017a, 2017b) derived power for indirect effects in group-randomized trials. They focused on a randomized and binary treatment, a normal mediator, and a normal outcome. Group-randomized trials randomize treatments at the group or site level and thus do not allow for investigating between-site heterogeneity. More and more multi-site trials have been designed for assessing between-site heterogeneity of treatment effects. To better understand why a treatment effect varies across sites, it is crucial to further investigate the heterogeneity of the underlying mechanisms via multi-site causal mediation analysis (Qin & Hong, 2017; Qin et al., 2019; Qin et al., 2021a). However, no power analysis tools have been developed for this line of research. The proposed power analysis tool can be extended by replacing the single-level models in Steps 1 and 2 with multilevel models for researchers to determine the sample size per site and number of sites required for such studies.
Fifth, additional extensions can be made for power analysis for causal mediation analysis that involves multiple mediators, power analysis for longitudinal mediation analysis, and power analysis that incorporates missing data or measurement error.
Sixth, in addition to the power of detecting an effect, there could be other targets of sample size planning, such as the accuracy in parameter estimation (e.g., Kelley & Maxwell, 2003) and the strength of evidence for competing hypotheses based on Bayes factors (e.g., Schönbrodt & Wagenmakers, 2018). Extensions can be made to develop sample size planning methods for causal mediation analyses that aim at these alternative targets.
Change history
22 March 2024
A Correction to this paper has been published: https://doi.org/10.3758/s13428-024-02386-4
Notes
The total indirect effect here is different from that known as the sum of multiple indirect effects in a mediation analysis with multiple mediators.
These values are specified based on the theoretical relationship of the skewness and kurtosis that kurtosis ≥ skewness2 − 2 (Qu et al., 2020).
By standardization, we mean the variable is standardized to have a mean of 0 and a standard deviation of 1 throughout the paper.
To gain empirical knowledge about such a proportion from a pilot study or a reanalysis of data from previous studies, we can regress T on X and divide the variance explained by X by the variance of T. If T is binary, we can calculate the variance of T∗ after predicting T∗from a probit regression of T on X. The same idea applies to the proportions of the variances in the mediator and outcome explained by X. Note that power is calculated based on the assumption that X includes all the potential pretreatment confounders. Otherwise, the indirect and direct effect estimates would be biased. Therefore, the specification of \({R}_x^2\)’s should account for the variances explained by all the potential pretreatment confounders. If some pretreatment confounders are missing from the empirical data, the empirically calculated \({R}_x^2\)’s need to be incremented based on theoretical reasoning.
I have verified through simulations that power depends on the number of covariates and \({R}_x^2\) contributed by the set of covariates as a whole, but is not affected by how much \({R}_x^2\) each specific covariate contributes and how the multiple covariates are correlated.
The R package was developed based on Vale and Maurelli (1983), which extended Fleishman (1978) from generating data from a univariate nonnormal distribution to generating data from a multivariate nonnormal distribution. In order to use the package to generate a single nonnormal variable, we can simply generate two independent variables with the same mean, standard deviation, skewness, and kurtosis, and use either one of them.
If I fix the number of covariates at 1 and rerun the simulations under each scenario, the relative change rate of the calculated sample size is less than 5%, which is due to the uncertainty of simulations. Therefore, a change rate of 22% when the number of covariates is increased from 1 to 10, which is much larger than 5%, indicates a nontrivial influence of the number of covariates.
As explicated in step 1 in the section introducing the simulation-based approach, a standardized model standardizes each of the dependent variable and the independent variables to have a mean of 0 and a variance of 1. If the dependent variable is binary, its latent index is standardized instead (Grace et al., 2018). Hence, the intercepts of the standardized models, \({\beta}_0^m\) and \({\beta}_0^y\), are always 0.
References
Aldrich, J. H., & Nelson, F. D. (1984). Linear probability, logit, and probit models (Vol. No. 45). Sage.
Baron, R. M., & Kenny, D. A. (1986). The moderator–mediator variable distinction in social psychological research: Conceptual, strategic, and statistical considerations. Journal of Personality and Social Psychology, 51(6), 1173.
Bloom, H. S. (2008). The core analytics of randomized experiments for social research. The SAGE handbook of social research methods, 115–133.
Cohen, J. (1988). Statistical power analysis for the behavioral sciences. Lawrence Erlbaum Associates.
Cohen, J. (1990). Things I have learned (so far). American Psychologist, 45, 1304–1312.
Daniel, R., De Stavola, B., Cousens, S., & Vansteelandt, S. (2015). Causal mediation analysis with multiple mediators. Biometrics, 71(1), 1–14.
Fleishman, A. I. (1978). A method for simulating non-normal distributions. Psychometrika, 43(4), 521–532.
Fossum, J., & Montoya, A. (2023). When to use different tests for power analysis and data analysis for between-subjects mediation. Under review.
Fritz, M. S., & MacKinnon, D. P. (2007). Required sample size to detect the mediated effect. Psychological Science, 18(3), 233–239.
Grace, J. B., Johnson, D. J., Lefcheck, J. S., & Byrnes, J. E. (2018). Quantifying relative importance: Computing standardized effects in models with binary outcomes. Ecosphere, 9(6), e02283.
Hong, G., Deutsch, J., & Hill, H. D. (2015). Ratio-of-mediator-probability weighting for causal mediation analysis in the presence of treatment-by-mediator interaction. Journal of Educational and Behavioral Statistics, 40, 307–340.
Hong, G., Yang, F., & Qin, X. (2023). Post-treatment confounding in causal mediation studies: A cutting-edge problem and a novel solution via sensitivity analysis. Biometrics. In press.
Imai, K., Keele, L., & Tingley, D. (2010a). A general approach to causal mediation analysis. Psychological Methods, 15, 309.
Imai, K., Keele, L., & Yamamoto, T. (2010b). Identification, inference and sensitivity analysis for causal mediation effects. Statistical Science, 25(1), 51–71.
Kelcey, B., Dong, N., Spybrook, J., & Cox, K. (2017a). Statistical power for causally defined indirect effects in group-randomized trials with individual-level mediators. Journal of Educational and Behavioral Statistics, 42(5), 499–530.
Kelcey, B., Dong, N., Spybrook, J., & Shen, Z. (2017b). Experimental power for indirect effects in group-randomized studies with group-level mediators. Multivariate Behavioral Research, 52(6), 699–719.
Kelley, K., & Maxwell, S. E. (2003). Sample size for multiple regression: Obtaining regression coefficients that are accurate, not simply significant. Psychological Methods, 8(3), 305.
King, G., Tomz, M., & Wittenberg, J. (2000). Making the most of statistical analyses: Improving interpretation and presentation. American Journal of Political Science, 44(2), 347–361.
Liu, X., & Wang, L. (2019). Sample size planning for detecting mediation effects: A power analysis procedure considering uncertainty in effect size estimates. Multivariate Behavioral Research, 54(6), 822–839.
Liu, S., & Yamamoto, T. (2020). How much should you trust your power calculation results? Power Analysis as an Estimation Problem.
MacKinnon, D. P., Lockwood, C. M., & Williams, J. (2004). Confidence limits for the indirect effect: Distribution of the product and resampling methods. Multivariate Behavioral Research, 39(1), 99–128.
Mauro, R. (1990). Understanding LOVE (left out variables error): A method for estimating the effects of omitted variables. Psychological Bulletin, 108(2), 314.
Montoya, A. K. (2022). Selecting a within- or between-subject Design for Mediation: Validity, causality, and statistical power. Multivariate Behavior Research.
Muthén, L. K., & Muthén, B. O. (2002). How to use a Monte Carlo study to decide on sample size and determine power. Structural Equation Modeling, 9(4), 599–620.
Neyman, J., & Iwaszkiewicz, K. (1935). Statistical problems in agricultural experimentation. Supplement to the Journal of the Royal Statistical Society, 2, 107–180.
Pearl, J. (2001). Direct and indirect effects. In J. Breese & D. Koller (Eds.), Proceedings of the seventeenth conference on uncertainty in artificial intelligence (pp. 411–420). Morgan Kaufmann.
Preacher, K. J., & Selig, J. P. (2012). Advantages of Monte Carlo confidence intervals for indirect effects. Communication Methods and Measures, 6(2), 77–98.
Qin, X., Deutsch, J., & Hong, G. (2021a). Unpacking complex mediation mechanisms and their heterogeneity between sites in a job corps evaluation. The Journal of Policy Analysis and Management, 40(1), 158–190.
Qin, X., & Hong, G. (2017). A weighting method for assessing between-site heterogeneity in causal mediation mechanism. Journal of Educational and Behavioral Statistics, 42(3), 308–340.
Qin, X., Hong, G., Deutsch, J., & Bein, E. (2019). Multisite causal mediation analysis in the presence of complex sample and survey designs and non-random nonresponse. The Journal of the Royal Statistical Society Series A (Statistics in Society), 182(4), 1343–1370.
Qin, X., Wormington, S., Guzman-Alvarez, A., & Wang, M.-T. (2021b). Why does a growth mindset intervention impact achievement differently across secondary schools? Unpacking the mediation mechanism from a national multisite randomized experiment. The Journal of Research on Educational Effectiveness, 14(3), 617–644.
Qin, X., & Wang, L. (2023). Causal moderated mediation analysis: Methods and software. Behavior Research Methods: In press.
Qin, X., & Yang, F. (2022). Simulation-based sensitivity analysis for causal mediation studies. Psychological Methods.
Qu, W. & Zhang, Z. (2020). Mnonr: A generator of multivariate non-Normal random numbers. R package version 1.0.0. https://CRAN.R-project.org/package=mnonr.
Qu, W., Liu, H., & Zhang, Z. (2020). A method of generating multivariate non-normal random numbers with desired multivariate skewness and kurtosis. Behavior Research Methods, 52, 939–946.
Raudenbush, S. W. (1997). Statistical analysis and optimal design for cluster randomized trials. Psychological Methods, 2(2), 173.
Robins, J. M., & Greenland, S. (1992). Identifiability and exchangeability for direct and indirect effects. Epidemiology, 3, 143–155.
Rubin, D. B. (1978). Bayesian inference for causal effects: The role of randomization. The Annals of Statistics, 6, 34–58.
Rubin, D. B. (1980). Randomization analysis of experimental data: The fisher randomization test comment. Journal of the American Statistical Association, 75, 591–593.
Rubin, D. B. (1986). Statistics and causal inference: Comment: Which ifs have causal answers. Journal of the American Statistical Association, 81, 961–962.
Rubin, D. B. (1990). Formal mode of statistical inference for causal effects. Journal of Statistical Planning and Inference, 25, 279–292.
Rudolph, K. E., Goin, D. E., & Stuart, E. A. (2020). Rudolph et al. Respond to “power in mediation analysis”. American Journal of Epidemiology, 189(12), 1571-1572.
Schoemann, A. M., Boulton, A. J., & Short, S. D. (2017). Determining power and sample size for simple and complex mediation models. Social Psychological and Personality Science, 8(4), 379–386.
Schönbrodt, F. D., & Wagenmakers, E. J. (2018). Bayes factor design analysis: Planning for compelling evidence. Psychonomic Bulletin & Review, 25(1), 128–142.
Tchetgen Tchetgen, E. J., & Shpitser, I. (2012). Semiparametric theory for causal mediation analysis: Efficiency bounds, multiple robustness, and sensitivity analysis. Annals of Statistics, 40, 1816.
Thoemmes, F., MacKinnon, D. P., & Reiser, M. R. (2010). Power analysis for complex mediational designs using Monte Carlo methods. Structural Equation Modeling, 17(3), 510–534.
Tingley, D., Yamamoto, T., Hirose, K., Keele, L., & Imai, K. (2014). Mediation: R package for causal mediation analysis.
Vale, C. D., & Maurelli, V. A. (1983). Simulating multivariate nonnormal distributions. Psychometrika, 48(3), 465–471.
VanderWeele, T. J. (2020). Invited commentary: Frontiers of power assessment in mediation analysis. American Journal of Epidemiology, 189(12), 1568–1570.
VanderWeele, T. J., & Vansteelandt. (2009). Conceptual issues concerning mediation, interventions and composition. Statistics and its Interface, 2, 457–468.
VanderWeele, T. J., & Vansteelandt, S. (2010). Odds ratios for mediation analysis for a dichotomous outcome. American Journal of Epidemiology, 172(12), 1339–1348.
VanderWeele, T. J., Vansteelandt, S., & Robins, J. M. (2014). Effect decomposition in the presence of an exposure-induced mediator-outcome confounder. Epidemiology, 25(2), 300–306.
Vansteelandt, S., Bekaert, M., & Lange, T. (2012). Imputation strategies for the estimation of natural direct and indirect effects. Epidemiologic Methods, 1(1), 131–158.
Vittinghoff, E., Sen, Ś., & McCulloch, C. E. (2009). Sample size calculations for evaluating mediation. Statistics in Medicine, 28(4), 541–557.
Vo, T., Superchi, C., Boutron, I., & Vansteelandt, S. (2020). The conduct and reporting of mediation analysis in recently published randomized controlled trials: Results from a methodological systematic review. Journal of Clinical Epidemiology, 117, 78–88.
Zhang, Z. (2014). Monte Carlo based statistical power analysis for mediation models: Methods and software. Behavior Research Methods, 46(4), 1184–1198.
Acknowledgements
The research reported in this study was made possible by a grant from the Spencer Foundation (202100132), a U.S. Department of Education Institute of Education Sciences Grant (R305D200031), a National Institutes of Health Grant (R01AG080590), and the 2022 National Academy of Education (NAEd)/Spencer Postdoctoral Fellowship Program. The views expressed are those of the author and do not necessarily reflect the views of the foundations. The author thanks Drs. Kenneth Frank, Guanglei Hong, Amanda Kay Montoya, Lijuan Wang, and Zhiyong Zhang for their insightful suggestions and comments on previous versions of the manuscript. In addition, comments from the Associate Editor and the reviewers have led to major improvements in this article.
Author information
Authors and Affiliations
Corresponding author
Additional information
Open Practices Statement
The web application has already been published online: https://xuqin.shinyapps.io/CausalMediationPowerAnalysis/.
Publisher’s note
Springer Nature remains neutral with regard to jurisdictional claims in published maps and institutional affiliations.
Appendices
Appendix A. Proofs of identification of causal effects
As a supplement to the identification section, this appendix proves the identification results of the causal mediation effects.
As proved by Imai et al. (2010b) and VanderWeele and Vansteelandt (2009),
where t and t′ are any two different levels of the treatment. The third and fifth equalities hold based on Assumptions 1 and 2. The fourth and sixth equalities hold based on Assumptions 3 and 4. The same idea applies to the identifications of E[Yi(t′, Mi(t))], E[Yi(t, Mi(t))], and E[Yi(t′, Mi(t′))]. By taking contrasts of expected potential outcomes, we can identify the causal mediation effects defined in Table 1.
Continuous mediator and continuous outcome
Based on Eq. 1, we can identify that
Similarly,
Hence, based on the definitions in Table 1, we can finally identify the causal effects as
Continuous mediator and binary outcome
Based on Eq. 2, we can identify that
where Φ represents the cumulative density function of the standard normal distribution, and the last equation holds because \({\varepsilon}_{mi}\sim N\left(0,{\sigma}_m^2\right)\) and \({\varepsilon}_{y_i^{\ast }}\sim N\left(0,1\right)\). Hence,
The same applies to the identifications of E[Yi(t′, Mi(t))], E[Yi(t, Mi(t))], and E[Yi(t′, Mi(t′))]. We are then able to identify each causal effect by taking a contrast of expected potential outcomes.
Binary mediator and continuous outcome
Based on Eq. 3, we can identify that
Hence, based on the definitions in Table 1, we can finally identify the causal effects as
Binary mediator and binary outcome
Based on Eq. 4, we can identify that
Similarly, we can identify [Yi(t′, Mi(t))], E[Yi(t, Mi(t))], and E[Yi(t′, Mi(t′))]. Each causal effect can be identified via a contrast of expected potential outcomes.
Appendix B. Derivations of \({\beta}_x^t,{\beta}_x^m,\) and \({\beta}_x^y\) for data generation
This appendix derives \({\boldsymbol{\beta}}_x^t,{\boldsymbol{\beta}}_x^m,\) and \({\boldsymbol{\beta}}_x^y\) based on the parameters that users are required to specify, \({\beta}_t^m,{\beta}_t^y,{\beta}_m^y,{\beta}_{tm}^y,{R}_{tx}^2,\) \({R}_{mx}^2,\) and \({R}_{yx}^2\), where \({R}_{tx}^2,\) \({R}_{mx}^2,\) and \({R}_{yx}^2\) are respectively the proportion of the variance in T (or T∗ if T is binary) explained by X, the proportion of the variance in M (or M∗ if M is binary) explained by X, and the proportion of the variance in Y (or Y∗ if Y is binary) explained by X, without controlling for any variables.
I first focus on a single standard normal covariate X. If the treatment is not randomized, and the treatment, mediator, and outcome are all continuous, the following standardized regressions are used for data generation.
where \({\hat{\beta}}_x^t={R}_{tx}.\) In the mediator model, based on the ordinary least squares (OLS) estimator
where T = (T1, …, Tn)′, X = (X1, …, Xn)′, and M = (M1, …, Mn)′ for n individuals, and they are all standardized, we can calculate \({\beta}_x^m\) as
which is consistent with Eq. 1 in Mauro (1990). Similarly, in the outcome model, based on the OLS estimator
where TM = (T1M1, …, TnMn)′ and Y = (Y1, …, Yn)′ for n individuals, and they are all standardized, we can calculate \({\beta}_x^y\) as
where Rx, tm = 0 because \({R}_{x, tm}=\frac{\textrm{E}(XTM)-\textrm{E}\left(X\left)\textrm{E}\right( TM\right)}{\sqrt{\textrm{Var}\left(X\left)\textrm{Var}\right( TM\right)}}\), where E(X) = 0, Var(X) = 1,
Var(TM) = Var(T)Var(M) + Var(T)E(M)2 + Var(M)E(T)2 = 1, and
where E(X3) = 0, \(E\left({\varepsilon}_t^2X\right)=E\left({\varepsilon}_t^2\right)E(X)=0\), E(X2εt) = E(X2)E(εt) = 0, E(X2εm) = E(X2)E(εm) = 0, and E(Xεtεm) = E(X)E(εt)E(εm) = 0.
Therefore,
If the number of covariates is p, p independent standard normal covariates are generated. I have verified through simulations that power depends on the number of covariates and \({R}_x^2\) contributed by the set of covariates as a whole but is not affected by how much \({R}_x^2\) each specific covariate contributes and how the multiple covariates are correlated. Therefore, based on the assumption that the covariates evenly partition each of \({R}_{tx}^2\), \({R}_{mx}^2\), and \({R}_{yx}^2\), the coefficient of each covariate in each model can be calculated as the previously derived coefficient of the single covariate divided by \(\sqrt{p}\).
Above, I focus on a nonrandomized treatment and continuous treatment, mediator, and outcome. If the treatment is randomized, Rtx = 0. If any of the treatment, mediator, and outcome is binary, the corresponding model becomes a latent regression, and the corresponding \({R}_x^2\) is defined as the proportion of the variance in the latent index of the corresponding response explained by X, and thus the Eqs. (B.1) and (B.2) still apply. However, Rx, tm is different under different scenarios. Its derivation is particularly tricky if T and/or M are binary. In addition, when T (or M) is binary, Rtx in Eq. (B.1) and Eq. (B.2) (or Rmx in Eq. (B.2)) is the correlation between X and the predictor T (or M), which is on the original scale rather than the latent scale, and thus it needs to be recalculated. These difficulties can be greatly alleviated by calculating Rx, tm, Rtx, and Rmx with simulated data. The accuracy of the approach has been verified through simulations.
As shown above, the calculation of βx’s depends on not only \({R}_x^2\)’s but also the signs of Rx’s. Nevertheless, the latter plays a trivial role with respect to power. When both the mediator and outcome are continuous and X is standardized, the effect estimands do not depend on βx, in which case power is not affected by the signs of Rx’s. When the mediator and/or outcome is binary and X is standardized, although βx is involved in the effect estimands, I have verified through simulations that different signs of Rx’s make little difference in power under various scenarios. Therefore, I calculate each Rx as the square root of the corresponding \({R}_x^2\).
Appendix C. Simulations comparing the Monte Carlo method and the bootstrapping method when the mediator and outcome are nonnormal
I conducted Monte Carlo simulations to compare the performance of the Monte Carlo confidence interval method and the bootstrapping method in terms of bias, mean squared error (MSE), 95% confidence/credible interval (CI) coverage rate, type I error rate, and power for the estimation and inference of the causal mediation effects under various scenarios that vary by the sample size and the skewness and kurtosis of the distributions of the mediator and the outcome.
Data generation
Focusing on a randomized treatment, I generated the treatment T from a Bernoulli distribution with Pr(T) = 0.5 and generated the pretreatment covariate X from a standard normal distribution. I generated the continuous mediator and outcome based on the following models:
where \({\beta}_{00}^m\) and \({\beta}_{00}^y\) are set to be 0 in all the scenarios; εM and εY have a mean of 0, a variance of 1, and different values of skewness and kurtosis under different scenarios. I considered three different sets of parameter values. In set 1, all the parameters take the value of 0, so that type I error rates can be assessed. Sets 2 and 3 are selected from those considered in the section of sample size planning, as shown in Table 3. Set 2 is the smallest set of parameter values, in which \({\beta}_t^y=0.14\) (S), \({\beta}_m^y=0.14\) (S), \({\beta}_{tm}^y=0.1\) (HS), \({R}_{mx}^2={R}_{yx}^2=0.02\) (S), \({\beta}_t^m=0.14\) (S). Set 3 is the largest set of parameter values, in which \({\beta}_t^y=0.36\) (M), \({\beta}_m^y=0.27\) (HM), \({\beta}_{tm}^y=0.14\) (S), \({R}_{mx}^2={R}_{mx}^2=0.075\) (HM), \({\beta}_t^m=0.27\) (HM). In addition, we considered three different sample sizes, 30, 50, and 150, and three different sets of skewness and kurtosis of the distributions of the mediator and the outcome, (1, 1), (2, 3), and (3, 8). In total, there are 3 × 3 × 3 = 27 different scenarios. For each scenario, I generated 10,000 replications.
Software implementation
I ran the simulations in R. I generated εM and εY with the R package mnonr (Qu & Zhang, 2020). To implement the bootstrapping algorithm, I used the boot function and generated 1000 bootstrapped samples for each replication. Confidence intervals are constructed using the bootstrap percentile interval.
Evaluation criteria
Given the three different sets of model parameters values, we obtain three sets of true values of PIE, TIE, PDE, TDE, and INT: (1)(0, 0, 0, 0, 0)’, (2) (0.04, 0.08, 0.26, 0.30, 0.04)’, (3) (0.14, 0.25, 0.67, 0.77, 0.10)’. The true effects are calculated in the same way as noted below Table 2. Let δ denote each true effect and \({\hat{\delta}}_i\) be the estimate obtained from the ith replication. The following evaluation criteria are used to evaluate the performance of each method. (1) Bias \(=\frac{\sum_{i=1}^{\textrm{10,000}}\left({\hat{\delta}}_i-\delta \right)}{\textrm{10,000}}\) for δ = 0, and relative bias \(=\frac{\sum_{i=1}^{\textrm{10,000}}\left({\hat{\delta}}_i-\delta \right)}{\textrm{10,000}\delta }\) for δ ≠ 0. (2) MSE \(=\frac{\sum_{i=1}^{\textrm{10,000}}{\left({\hat{\delta}}_i-\delta \right)}^2}{\textrm{10,000}}\). (3) 95% CI coverage rate \(=\frac{\#\left({\hat{L}}_i\le \delta \le {\hat{U}}_i\right)}{\textrm{10,000}}\), where \(\left[{\hat{L}}_i,{\hat{U}}_i\right]\) is the 95% CI of the ith replication, and \(\#\left({\hat{L}}_i\le \delta \le {\hat{U}}_i\right)\) is the number of replications with CI that includes δ. (4) Rejection rate \(=\frac{\#\left({\hat{L}}_i>0\ or\ {\hat{U}}_i<0\right)}{\textrm{10,000}}\), where \(\#\left({\hat{L}}_i>0\ or\ {\hat{U}}_i<0\right)\) is the number of replications that reject the null hypothesis that δ = 0 with the significance level alpha at 0.05. The rejection rate is the power when δ ≠ 0 and is the type I error rate when δ = 0.
Simulation results
We present the simulation results for PIE, TIE, PDE, TDE, and INT in Appendix Tables 8, 9, 10, 11 and 12 respectively.
Under the three sets of parameter values, the 95% CI coverage rate of INT is always away from 95% when the sample size is small. To find a scenario when the 95% CI coverage rate gets close to 95%, I increase the true value of INT by increasing \({\beta}_{tm}^y\) from S to HM. Hence, in Appendix Table 12, I further incorporate the simulation results based on Set 4 of the parameter values, \({\beta}_t^y=0.36\) (M), \({\beta}_m^y=0.27\) (HM), \({\beta}_{tm}^y=0.27\) (HM), \({R}_{mx}^2={R}_{mx}^2=0.075\) (HM), \({\beta}_t^m=0.27\) (HM), which leads to a true natural treatment-by-mediator interaction effect of 0.20.
Appendix D. Sample size planning when the number of covariates is 10
Rights and permissions
Springer Nature or its licensor (e.g. a society or other partner) holds exclusive rights to this article under a publishing agreement with the author(s) or other rightsholder(s); author self-archiving of the accepted manuscript version of this article is solely governed by the terms of such publishing agreement and applicable law.
About this article

Cite this article
Qin, X. Sample size and power calculations for causal mediation analysis: A Tutorial and Shiny App. Behav Res 56, 1738–1769 (2024). https://doi.org/10.3758/s13428-023-02118-0
Accepted:
Published:
Issue Date:
DOI: https://doi.org/10.3758/s13428-023-02118-0